Friday, July 31, 2009
Insider Trading

....and will close my brief intermezzo on Liquidity and Flow.
- the insider charts are the most revealing whenever they diverge from Mr. Market, meaning Insider buy when the market sells off or sell when others buy
- In 2009 we see that a fair amount of selling into strength took place on the insider front. The next weeks will reveal who is buying since Jul 8, but it appears that the insider already cashed in......around the time when we learnt that "the recession is over"
Thursday, July 30, 2009
There is a MONSTER coming...

- Just looking at the Indicators we can observe a MONSTER DIVERGENCE where the VIX_OSC went opposite of Mr. Market
- If history is any guide then we enter a high propability phase for some major correction
- this does not exclude the possibility that the VIX_OSC sports another lower High over the next month or two
- Chances are that the Monster is fairly well developed
Mutual Fund Flow data...
Wednesday, July 29, 2009
Tuesday, July 28, 2009
Volume and Equity Options signal danger....
Monday, July 27, 2009
How long can the bull run......

Sunday, July 26, 2009
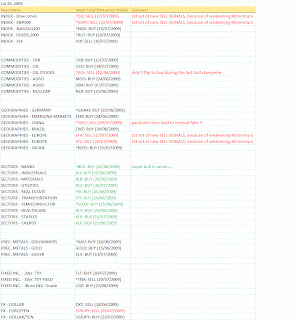
SUSI WEEKLY UPDATE
Thursday, July 23, 2009
Quick market commentary & HFT update

- We have reached a good exhaustion level in the NASDAQ Demand Pressure 2 (% above Volatility Band 2) whichshould provide good downside once the market flips
- Another good bloomberg video and a New York Times article that shows you that HFT Traders cannot hide anymore
- The HFT's ("HAL9000's") will play all the conventional analytical tools therefore it is no wonder that for instance more that more Patterns fail (my 2nd Derivative theme and here). This was my primary reason to develop SUSI to have tool that is not in the mainstream and also stresses more the liquidity aspect than staightforward price levels (which are easier to capture for the Hal9000's)
- The market has gone in overdrive which is typical for Megaphone patterns or broading tops
- Exuberance will have to face reality (see Fari )
- Fundamentals differ from the Exuberance (here and see here) and will catch up with the Market once the HAL9000 HFT Machines turn around. SUSI will tell us when the time has arrived which should be fairly soon
- Pls also bear in mind the differnt timeframes:
short term:bull
med term: bear market rally
long term: bear market
Wednesday, July 22, 2009
Good reversal level in the VIX_OSC

- Pls bear in mind that the VIX_OSC measures the relative realtionship btw the S&P500 and the VIX (frontrunning of the VIX)
- It is also important to note that most Sentiment Indicators tend to be confirming rather than leading Indicators (although the VIX_OSC seem to have some good leading qualities !!)
- It's just another piece in the puzzle that offers Mr. Market an opportunity (good probability) to retrace, we will find out whether he'll take it.......
Tuesday, July 21, 2009
80% of Stocks are above their 200d MA !!
The Liquidity Mirage or what you should know about High Frequency Trading
- This seems like an exotic topic for the trading aficinados only.
- This is also not a trivial topic.
- This is another example of how my 2nd Derivative theme, where the smartest and sharpest minds found ways to exploit "commonly accepted and employed procedures" of the "average" institutional investor.
- This is most likely right now the most profitable and risk minimal trading strategy on Wall Street. (Zero guesses $ 4bn for Goldman alone per year)
- This works because most participants (read YOU and YOUR investment and/ or mutual funds) don't even know that they are fleeced (you know about the old proverb saying that if you don't know who the sucker is it is most likely YOU...).
- This is completely legal !!
good Videos explaining the basics.....
http://zerohedge.blogspot.com/2009/07/joe-saluzzi-provides-further-color-on.html
http://zerohedge.blogspot.com/2009/07/themis-trading-principal-program.html
related white paper http://www.themistrading.com/article_files/0000/0348/Toxic_Equity_Trading_on_Wall_Street_12-17-08.pdf
or here
http://zerohedge.blogspot.com/2009/07/toxic-equity-trading-order-flow-on-wall.html
more background info on Program Trading on the NYSE
http://zerohedge.blogspot.com/2009/07/is-case-of-quant-trading-industrial.html
This also means that you have to be very careful with your standard VOLUME analysis, because the volume you see is a derivative of program trading and black pools and might not represent liquidity in the original sense.
hat tip to http://zerohedge.blogspot.com/ for their in depth coverage
SUSI SELL SIGNAL

- The S&P500 and the Dow are showing Sell signals
- The market is deeply overbought and could correct from here.....
- Still we have the 2 range defining "make or break" areas (875 and 950#s) that we have to overcme to this market a direction
- CAUTION: This is a fresh signal that could vanish if it doesn't get confirmed
Monday, July 20, 2009
NASDAQ Buying Pressure
Sunday, July 19, 2009
SUSI WEEKLY UPDATE

- Like a steamroller did the action of the OX week not take any prisoners
- Only a few bearish calls still stand
- The overall Sentiment and Bias is bullish, but I'd be very careful here to buy into the new nirwana too early
- When Pro's like FARI HAMZEI (who has a distinguished track record in the trading community) hint into the same direction and my SUSI only needs very little to flip entirely and if the insane OX action relieved all the OVERSOLD pressures .......then ask ask yourself:
WHAT VIEW WOULD MAKE ME A CONTRARION ..?
Friday, July 17, 2009
new bull leg or an OX mirage.....
- we clearly broke the elliott wave falsification line and now need to break the former high (S&P 500: 950 area) for the bull case....
- the weird news flow from Roubini to Meredith W.....
- buying pressure and new highs have turned bullish
- Vix_OSC has turned bullish
- ...if SUSI can take out the previous MAY/JUNE SUSI readings then we'd be on to something really bullish, maybe even a late summer "melt up"
Wednesday, July 15, 2009
What if SUSI is trying to warn us of a bull trap....?
Tuesday, July 14, 2009
The benefit of the doubt still goes with the BEARS....
- The bias is still bearish
- Let's see what happens after Wednesday in the OX-(option expiration)-week when most of the institutional players have rolled their positions
- The bulls have to show more stamina to paint the tape bullish again (maybe they can come up with some new fairy tale from goldilocks to green shoots to "stimulus2: now it works"
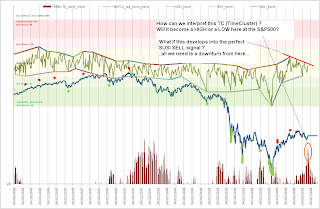
- Also still open is the question whether the bulls can take the opportunity of the TimeClusters around end of JULY and manufacture a bottom or whether the bears will keep control.....

VIX Future is flying again.../GOLDMAN/ BUSTED CHART PATTERNS

Monday, July 13, 2009
Elliott Wave update
Saturday, July 11, 2009
SUSI WEEKLY UPDATE

- The bears have captured the TAPE (pls see here and here )
- lots of HS breakdowns
- Commodities and here particularly OIL and SILVER took it on the chin
We saw some dramatic action this week with alludes to the potential of more de-leveraging along the way. On the other side the markets seems short term oversold which should limit the near term down action and lead to some pause. The various TimeClusters around next week to the end of the month seem to hint into the same direction.
In order to paint a more green shoot friendly picture the bulls have to re-capture the tape by building up buying pressure.
Wednesday, July 8, 2009
ANATOMY of the DEFLATION TRADE

(courtesy of http://finviz.com/forex.ashx )
|
Volume update
If we can see "deeper" Indicator readings in the various Indicators than we should expect a more protracted correction. As you can see in the top o the chart the up/tl Vol Indicator likes "doubles" or "tipltets"....
A bounce from here might indicate more sideways rather than downside action going fwd.

Institutional Selling Pressure
Breakdowns!!
Saturday, July 4, 2009
Green Shoots vs. Reality (0:1 after Friday's Employment data)
- "Who is profiting from this?",
- "What does it take to keep this current green shoots scenario alive?",
- "Will all this monetary stimulus lead to new home sales, new car sales, comsumption ?,
- "What are you doing on a personal level, spending or saving?",
- "Do we experience a fundamental psychological shift with respect to debt, like in the 1930's and will will this affect the next 80 yrs".......
- "Will people finally start to invest more time into their financial future than into the research of their next new car....?"
Friday, July 3, 2009
SUSI WEEKLY UPDATE

- Key sectors have flipped on the employment data (=Deflation trade supportive)
- Oil seems in a tail spin, but also watch the relative weakness in DBA (Agro Commodities) (=Deflation trade supportive)
- Prec. Metals seem vulnerable (=Deflation trade supportive)
- Nasdaq and Russel2000 are now on sell (=Deflation trade supportive)
Conclusion:
Green Shooters and Inflationistas need to find their mojo back soon, otherwise the other guys will control the tape over the next weeks....
Wednesday, July 1, 2009
Deflation Trade back on again?
Intermarket Analysis

- Pls. observe some of the technical damage in the various markets, from FX to Fixed Income to Stocks
- The market looks tired
- The only one that still seems hot is the TED Spread ( 3months Eurodollar - Fed Funds). This is also the market where the FED can do the most and where they hope that this will translate into the others..... . This should stimulate the banks to lend in a perfect world of econometric models.....
- The next weeks will have to prove the greenshoots with earning, employment data, ISM data, Production & Capacity utilisation etc.
Conclusion:
The next weeks will be very exciting !!


