Thursday, June 16, 2011

Mr. Market follows our ROADMAP


We posted on June 12 the following ROADMAP:

CONCLUSIONs:
  1. We have entered the airpocket with a material breakdown
  2. expect a test of the 200d SMA & the March 2011 LOW - already DONE !
  3. ...if the 200d SMA does NOT hold then expect a tumble though the airpocket and a subsequent test of the May 2010 in late July (August) seems likely
  4. ...if the MAY 2010 HIGH does NOT hold then plan for the FIBs (expect some sideways action around those levels given the Volume cluster in this price area)
  5. ...if we break through the summer LOW of 2011 expect more than a medium term correction
  • Each successful test can be the beginning of a continuation of the BULL (Think QE3)

update:
We should now see a pause or a bounce after testing the SMA 200. Pls bear in mind that the lower part of the AIRPOCKET has even 'less air' in it than the part we just cut throught. This means once we fall through the current levels we could see some quick move down through the entire AIRPOCKET testing the May 2010 High.

Wednesday, June 15, 2011

Oil could bounce from here...

On a day where Gold is rocksolid against a crashing EURO (1.4138) we want to have a look how far the Liquidation could go on 'the other GOLD', namely OIL.

With WTI around 95 (down 4+% !!) there could be some interesting opportunity for the brave (if they are not afraid of the falling knife).

On the other side as long as we see more DOLLAR strength I'd rather prefer the original GOLD ....


The bounce is not sticking......ouch

Tuesday, June 14, 2011

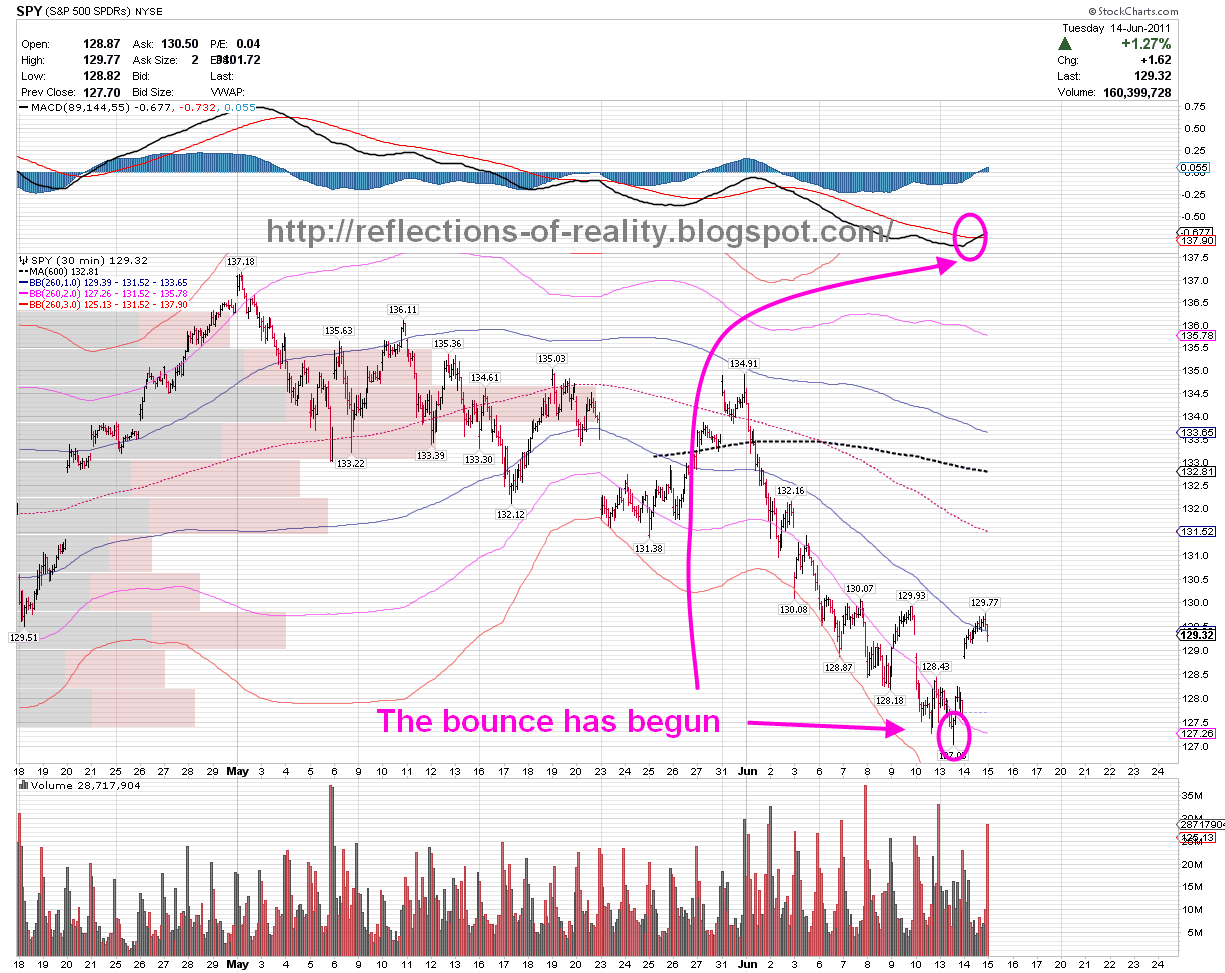
The Bounce has begun....

...but with banks showing (thing JPM !!) relative weakness. Mr. Market now has to prove whether he can challange the May HIGH !!

Sunday, June 12, 2011

Summer-Correction from BREADTH perspective

Let's assume we get a Summer-Correction, this is how this would look like from a Breadth point of view.

We would look for one major washout early on and then with weakening price action less extreme BREADTH spikes (a.k.a. Divergence).

Although the Bounce seems near I would not be surprised to a see washout beforehand , maybe testing the 200d SMA or some other level, followed by some volatile short covering.

Key takeaway nonethesless is the fact that the BREADTH-TREND has turned as seen by the flipped aggregate lines in the middle of the chart.

SPYDER ROADMAP 2011/2


OBSERVATIONs:
  1. AIR-POCKET: the market cut through this zone with low volume meaning we can expect the same on the downside due to the fact that only a minority of participants have entered in positions around there
  2. BREAKDOWN: we broke the trendline of the entire up move from 03/2009
  3. SUMMER HIGH 2010: the beginning of the airpocket and the summer high 2010 align
  4. Fibonacci Zone: The Fibs align with the correction levels of the late summer 2010 correction
  5. BEARZONE: A change oc character needs to show a shift of the RSI into the 20-65 RSI BEARZONE to confirm the BEAR
  6. medium term MACD: neg. Divergence & break

CONCLUSIONs:
  1. We have entered the airpocket with a material breakdown
  2. expect a test of the 200d SMA & the March 2011 LOW
  3. ...if the 200d SMA does NOT hold then expect a tumble though the airpocket and a subsequent test of the May 2010 in late July (August) seems likely
  4. ...if the MAY 2010 HIGH does NOT hold then plan for the FIBs (expect some sideways action around those levels given the Volume cluster in this price area)
  5. ...if we break through the summer LOW of 2011 expect more than a medium term correction
  • Each successful test can be the beginning of a continuation of the BULL (Think QE3)

Classical Liquidation Pattern

They all went down together....

...and also moved closer together.

Forget about fundamentals, this is called LIQUIDATION!

Summer dolddrums in the Precious Metals

Gold seems to take a breather into AUGUST.

Although when looked at in EUROs the picture looks slightly different which should be an effect of the expected Dollar strength.
Same take on the GOLD in EUROs exhaustion picture.
The Gold Optionflows paint a sluggish picture with no real conviction and some downward bias.

Banks are getting short-term oversold against a medium-term bearish picture

Saturday, June 11, 2011

FIXED INCOME looks vulnerable

Corporate Credit is getting exhausted....
...as is the 20yr Treasury...
Optionpicture points at downside risks....
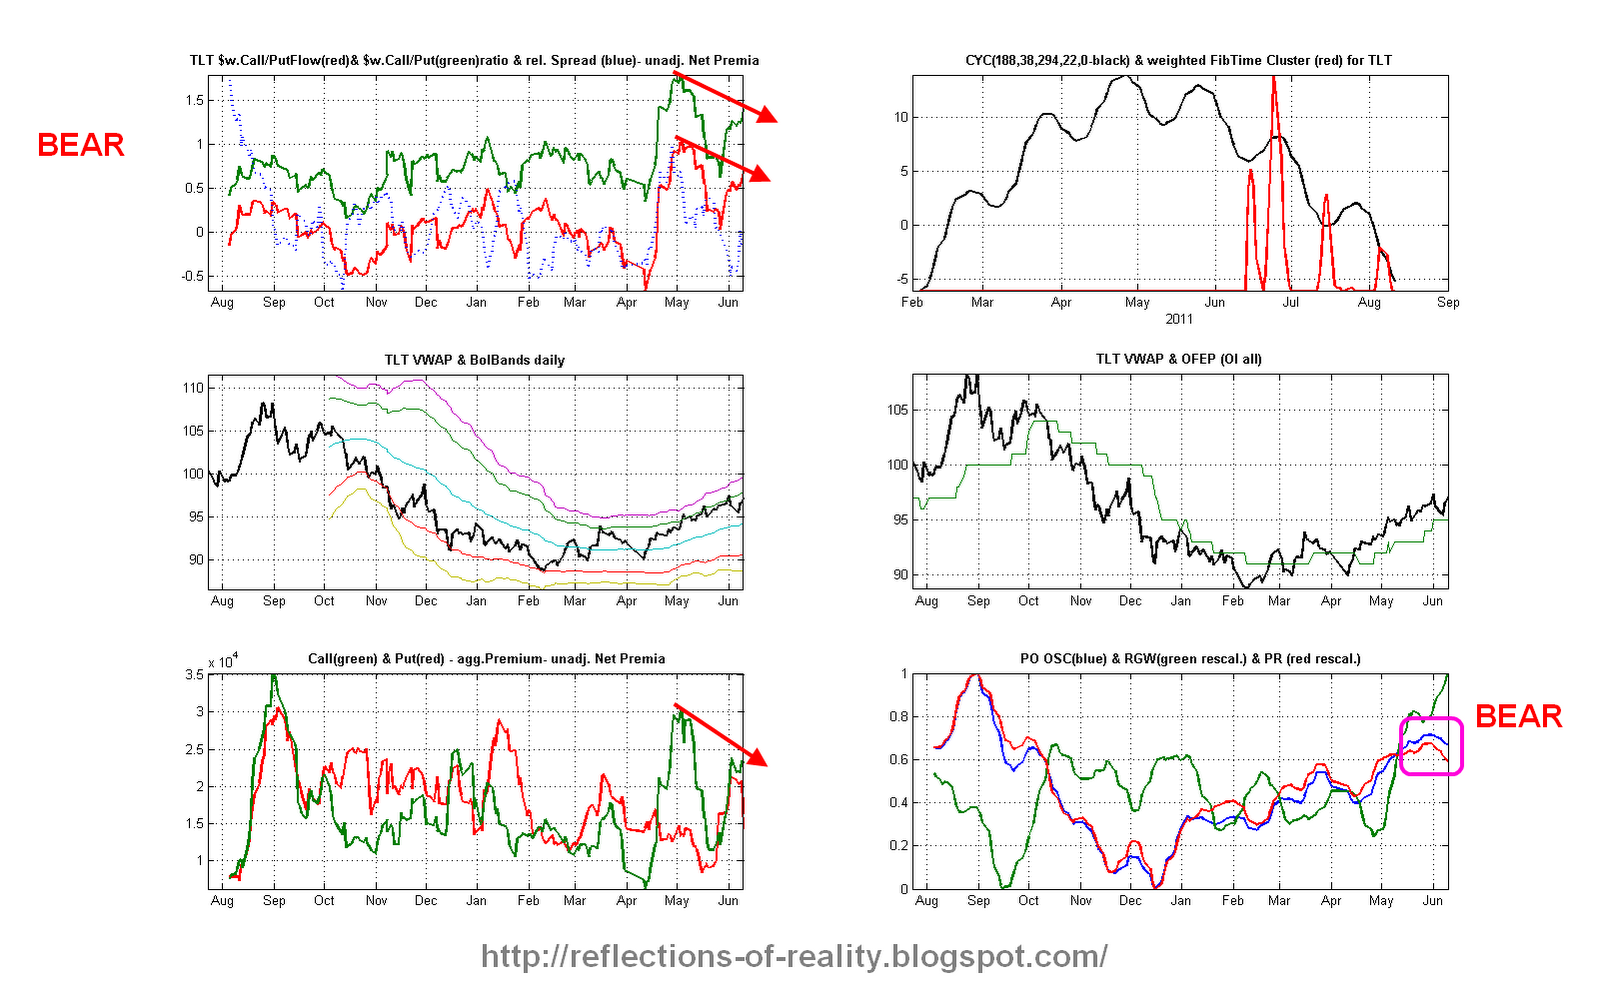
as is our Cycle model.
<==> higher Yields <==> stronger Dollar <==> weaker Commodities <==> weaker stocks
Oil could see some more downside...

Friday, June 10, 2011

Sentiment wants another final push down before the bounce

The workhorses are in negative territory and point down.

The ISE data has flipped down from a level below -0.1. In the past we had 3 instances that rhyme with today and all of them were part of a downdraft where the Market needed one final spasm down to exhaust and bounce.
The CBOE data tells a similar story also with a slightly different structure.

EURO BREAKDOWN

Wednesday, June 8, 2011

Summer ROADMAP for the Institutional Portfolio

The Market shows negative bearings which will result in a bounce that will retest the new market character.

Price MOMO is still pointing down while the MoneyFlow MOMO ticked down again. Our proprietary SPYDER optimized MOMO Indicator (bottom of the chart) looks oversold and hints at a bounce over the next week or so....
The TimingCycles model seems to be insync with the broken HS Pattern. Following this roadmap I expect a short-term bottom/ bounce around the mid of the month leading to a re-test of the Head&Shoulders break down and ultimately at least fullfilling the HS downside target into late July.

This all means a re-test of the March lows. These lows will ultimately decide whether the bull continues (triggered by QE3 ?) or whether we go into real bear territory.

Saturday, June 4, 2011

More Cycles jive with August

Gold/Silver Ratio:
Gold in Euros:

Mr. Market looks weak for the next months

Sell in May and go away could become a good theme for this summer. The market is med.-term exhausted and shows shorter term weakness.
The Options hints a probable bounce fairly soon but the key question is how far will it take us ?
The timing model interestingly confirms the above.
Precious Metals look a AUGUST and the SPYDER does the same as does the TLT. This all against the backdrop that the US$ wants to bottom.

Bear in mind that technical Analysis offers us a medium term context based on the anlysis of Patterns and Liquidity. This can all be distorted by short-term activism on the news front, like ....a new increased bailout for Greece.....QE3 etc.....but gravity usually reinstates itsself over time.

Thus this context gives us a the key perspective.

Rising Treasury rates ?

The TLT is exhausted and should pause/correct soon.
Our timing model confirms that view.

If rates go up (TLT down) then this will support a stronger US$ and a weaker Stock Market !!

Precious Metal look to correct through the summer

Buying Calls seems like a sure bet after the initial correction (especially in Silver and PM shares), but maybe the base building needs more time.
Our TimeCycles also think this way.


The former Cheerleaders lead the Market in tighter lockstep down

Our Correlation Analysis shows some remarkable results, namely that Tech, Banks, Materials and the Euro intensify their lockstep relationship in a weak market. There is no diversification just liquidity that drives this QE beast.

The flight out of BETA also shows up in the growing inverse relationship to the Healthcare Sector and Staples or defensive Sectors.


the Relative Strength analysis shows the same, that the former leaders lead the Market down and that there is no absolute hiding in a liquidity driven market, neither in Healthcare nor in Staples.


Friday, June 3, 2011

What is the DOLLAR doing ?

We stated in the past that the destiny of the Market is tied to the DOLLAR. So far we had a nice initial bounce in the Dollar which has been followed by another Retest of the LOW.

Our medium term CYCLE work wants to see the Dollar bottom. The FIB CLuster in the mid of June could indicate some short term top which would mean we should see some strength soon. (Beware that Fib Cluster just indicate PIVOTS , so this could also be the final bottom!)

Either way the DOLLAR is at a crossroads and will tell us fairly soon which case we should take as the base for further considerations.


Breadth has flipped too

Breadth has begun to portray some real weakness.


Here is a chart we occasionally show which gives you a BREADTH based LEADING INDICATOR the gives you a direction for the future but not the extend of a move. This means that if the red line goes down we expect weakness, but we cant tell whether this will be 5 or 50 points.

The chart also shows you our proprietary LIQUIDITY INDEX which signals the beginning of weakening LIQUIDITY.


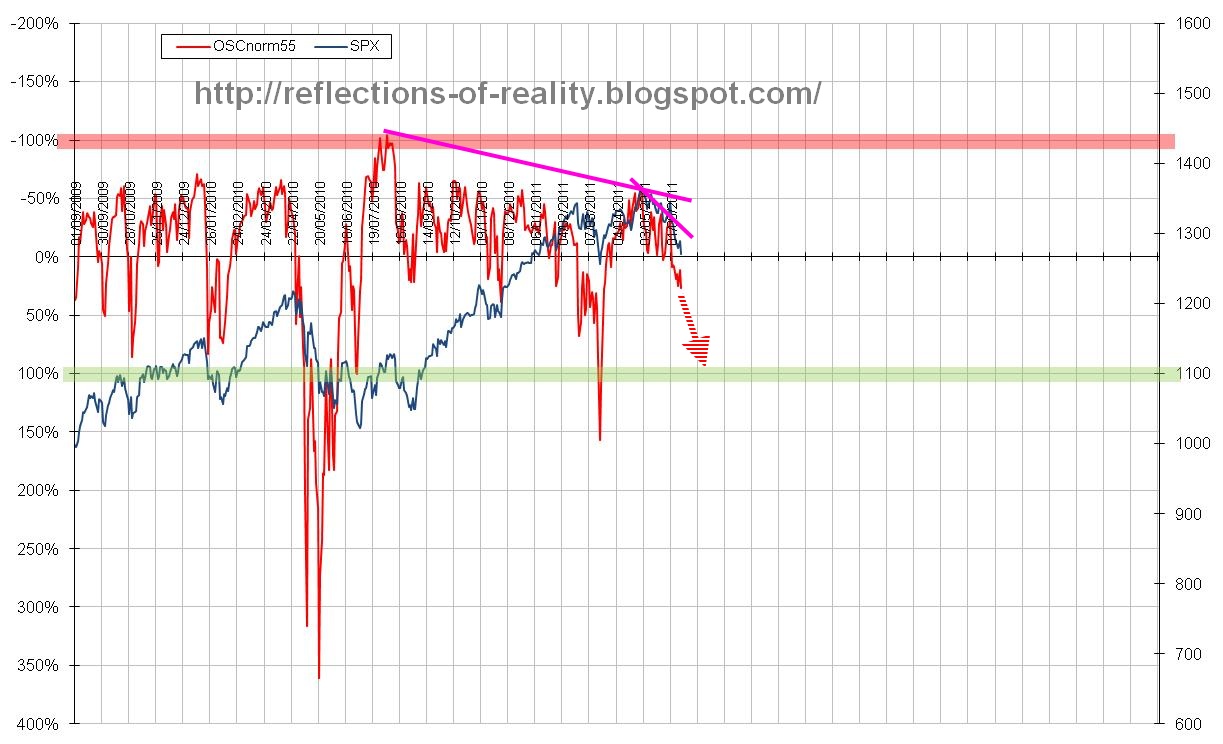
Our VIX_OSC has entered BEAR-Land