Saturday, April 21, 2012

Weekly update: Risk off vs. Commodities on ?

The Euro could be on the verge of some quick upside action. Next week will tell if we can see any follow through..
 The Miners look hopful supporting the story showing from the EURO...
 ...as does Gold...

...and Silver

...and OIL...
BUT on the other side we see that Tech has reversed...


 ..and Vola seems on the uptrend...
 ...with the leading Materials looking bearish

Bottom line:
We can make both cases at this juncture. The bounce can run for another week or the Prec. Metals can decide to ignore the risk trade and become more of a safehaven trade or the Euro reverses again.
Correlation trades might break. Let's see what happens after this wild OPEX week ... that was historically one of the most bullish weeks in the season and wasn't.

QE or NOT will be the question for the weeks to come unless you believe that a fix for Spain is in.....which we don't!

Bullish argument of the week: THE EURO

The TREND indicator has turned up (Thursday's chart before Friday's up-surge close to the weekly DeMark trendline).
 And the Cycle chart foresees a LOW right around here with a 3-4 week up bounce conceivable.
Maybe the Bounce has more tricks up his sleeve or maybe the EURO disconnects from the RISK TRADE.
We will see next week.

Golden5: Breadth has reversed down

The BREADTH of the large Cap. Institutional Portfolio has reversed down...


 ...as has the BREADTH of the  Institutional large Cap. Tech Portfolio

As you can see from the history it doesn't happen too often.

Thursday, April 19, 2012

Was this the Bounce ?

We promised you a 1-2 week bounce last week which came in the shape of a classic a-b-c correction Pattern.
The Pattern needs to morph into something new fairly quickly or this this market could see some further follow through on the downside. Most key TREND charts (we will provide some updates over the weekend) look bearish medium term.

Monday, April 16, 2012

GOLD milestones

ANATOMY of a BULL:

  1. upwards Reversal of the Trend Indicator
  2. Trend Indicator prints positive values
  3. VWAP/ Price captures all 3 Tom DeMark Sequential Trend-Reversal Levels (red lines for Monthly, Weekly, Daily trends) 
Current Status:
  1. upwards Reversal of the Trend Indicator accomplished
  2. Not reached yet
  3. partially accomplished

Saturday, April 14, 2012

Case for the short term bounce

MOMO  (weighted in our TREND Indicator) for Price and Money flows (highly weighted in our TREND Indicator) looks bearish, but the short term IWM optimized MOMO Indicator at the bottom ,that tends to react faster, looks prone for a bounce.


 OPEN INTEREST is medium term bearish.  (weighted in our TREND Indicator)
Here you see our TREND chart resembling the SPY, EWZ, XLB chart.
  EXHAUSTION is also  medium term bearish.  (weighted in our TREND Indicator)

The bounce could run for 1-2 weeks at best.

Weekly TimeCycles and Trend update:...maybe another final retest of the HIGH

This week we present a hodge podge of unsorted observations that all seem to support the idea that we might be close some short term exhaustion and that we could see another rally into the end of April. These shorter term scenarios need to be seen against a more bearish 6 month outlook into this fall.

Kind Dollar might weaken and not 'grow' on last week's momentum. MAY will be the month of the King !!

The brasil EWZ ETF has experienced more damage than the other markets but looks faily exhausted at least short term. We need the Monthly TD Trend to reverse (i.e. the fat dotted line been taken out) before we can conclude that we entered a real bear.
 Euro strength into May supports the notion of a near term rally.

 Even Gold in Euro seems to suffer from some upcoming Euro strength.
The GLD shows some promise but needs to do more work to support the BULL case.
 Timing seems supportive.
 Spyder, XLB, EWZ all tell the same story of a nice correction that has NOT turned into a BEAR !
 The medium term SPY picture looks bearish !!
 Oil might take a break into MAY.
 The VIX ETF portrays the flipside of the SPY, XLB.


Bottom Line:
Don't expect too much bearish action in the next 2-3 weeks. Wait for May before you sell....

Friday, April 13, 2012

Waiting for the Final Rally ?

Looking at the ISE, CBOE Option data and the fact that some Call/Put ratios have already flipped upwards on this big down day, I get the feeling that we are setting up for a 'typical' negative divergence.

In this scenario we would see some miracle 'Yeah, we saved Spain...QE X is coming - ' rally into the end of the month before hitting the 'SELL IN MAY' brickwall.

There is probably a good 50% chance for that outcome.


Monday, April 9, 2012

Miners are bombed out...but there is hope

The Prec. Metals Miners look really exhausted. All DeMark Sequential Counts are bearish. We show in red the levels that would reset the counts to the bullish side.

Apart from that we notive a Divergence which usually inidicates states of exhaustion with a tanking price while the TRend turns less negative.

 Timing looks promising on the other side.....

Saturday, April 7, 2012

What can we expect from Mr. Market next week ?

The amazing AAPL is already on the brink of another uptick again !!! Let's see whether AAPL can pull of another upswing!
 The Small Caps are looking for a correction.
 Tech, probably driven by AAPL, could move up again.

The Spyder seems to follow the Small Caps down....
 ...as seems OIL....
 ...with a timing target for the bottom around the end of April.
 The Materials (maybe Inflation affected) might follow Tech or the Prec. Metals .

Bottom Line:
Too many cross-currents, too muddy waters. At this stage of the 'rigged' game we have to look at Markets individually against that bigger backdrop that King Dollar should have a tendency to rise, Mr. Market to correct, Treasuries to correct and Prec. Metals to enjoy their seasonals......

Inflation or NOT ?

The Trend in Gold is ambivalent. The 5SMA could flip upwards again or confirm the bear. Good Friday's action hints at the former.
 The Timing model paints 2 scenarios.....

...one with a bottom in late April...
 ...one with a bottom around here...??
 The Trend on the 20yr Treasury on the other side looks for higer yields and a lower TLT ('Inflation', 'more money Printing', 'good for GOLD'...).

King Dollar: Quo Vadis after the NFP Employment data ?

Our DXY Timing model could envisage some further Dollar weakness into mid April or maybe into mid May.
Here we introduce another Indicator that will become our main compass going forward. Our Trend model aggregates various Exhaustion, MOMO, FLOW, Options Indicators (all of them LEADING Indicators) into one main TREND Indicator. A reading above ZERO is bullish and a negative reading is bearish. Usually do we want to see confirmation from the 5day moving average (SMA5) to confirm Trend changes.

In this case we see the pounding on the EURO has turned the trend extremely short-term bearish. We have no confirmation from the SMA5 (green bold line). This reiterated the meaning of the 1.3000 level. If 1.30 holds and the 5SMA flips upside and we see a correction in the DXY (top chart) then we are in the 60% case, whereby the odds are also at least 40% for a confirmation of the bear in the EURO.
Next couple of days will tell!!

Thursday, April 5, 2012

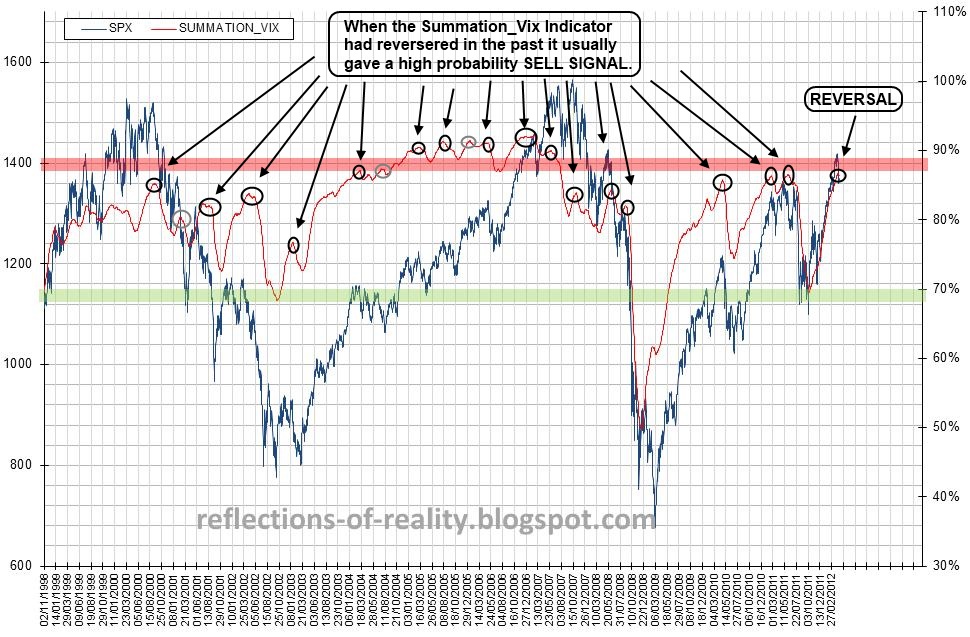
Now is a goot time for the TOP

We have reached a level in the accumulated VIX OSC that limited all moves since 2009.
 So when the VIX OSC turn negative the Accumulated Indicator (top chart) will turn around.

On the other side we have no clear view on the medium term cycles within the longer one shown in the graph, meaning there could be another test of the Top.


Ben and the King

What an amazing week, we listen to Ben's lectures telling the world that he will pull all stops if the economy is not moving into the right direction. The FED has a dual mandate and he relayed to the market that his priority is not Inflation at this stage. In result King Dollar moved 3 1/2 big figures (see (1)). Then all of a sudden we get the FOMC minutes relaying a more hawkish tone and King loses 3 big figures in 3 days. The amazing aspect is that the content of the minutues is older then Ben's speeches which everyone knows....so why not ignoring them and focus on the latest news.  <= THIS IS NOT A RATIONAL MARKET, THIS IS A TRADER'S MARKET no matter what the news outlets tell you.


The overall position is ambivalent where we have the line in the sand around 1.30, where we see the Price MOMO and the Money Flow MOMO of the FXE flipped to the bearish side....

 ....but where the timing model might hint at at least one more bounce.

Bottom line: WATCH 1.30