Showing posts with label History. Show all posts

Saturday, April 3, 2010

Are we entering into a new PARABOLIC UP PHASE ?

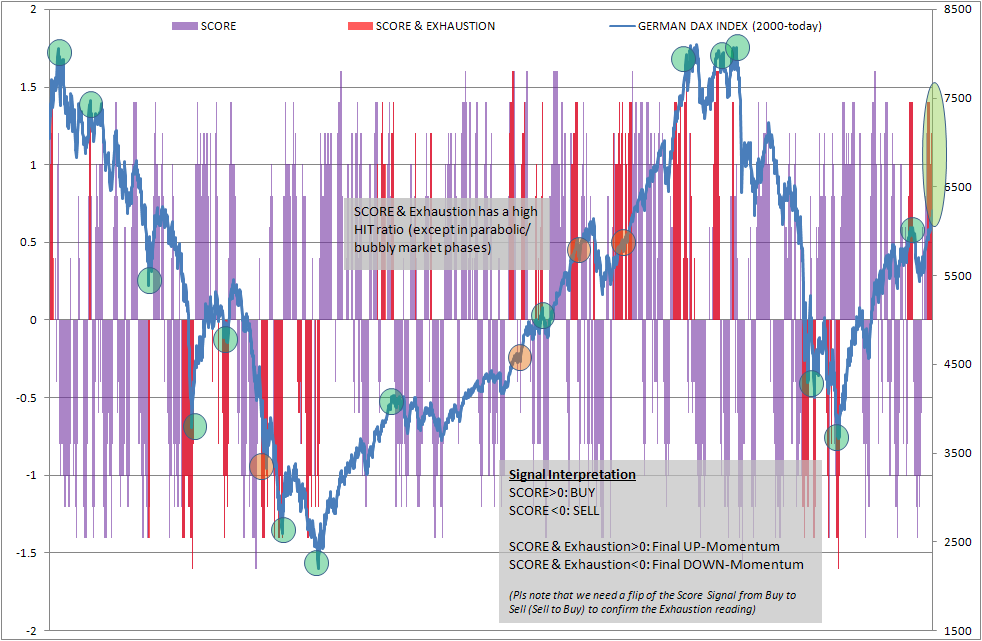
Historic EXHAUSTION Analysis of the GERMAN DAX INDEX from 1990-today:


We thought this week it would be helpful to provide some historical context behind the concept of Exhaustion. There are 1001 definitions of Exhaustion and each analyst is using his own secret recipe, but in the end all measures relate to some kind of measurement of Extremes.
The reason why I show you the 20 years of analysis is because it shows very graphically what exhaustion concepts can provide and what they CAN NOT. (A picture says more then a 1000 words!!)
The quality of Exhaustion Signals is fairly reliable with a slight tendency to be to early at HIGHs (which results from the fact that the LOWS are usually short term events/datapoints, like "MAR9, 2009-THE LOW", whereby HIGHs are more protracted processes).
BUT.....Exhaustion Signals have one significant shortfall, they don't work in parabolic/bubbly markets which are characterized by the notion that they simply move on against the backdrop of Exhaustion and ignore OVERBOUGHT & EXTREME readings.
WHAT DOES IT MEAN?
  • We are either entereing a new BULL and will ignore the EXHAUSTION or
  • We will see some serious downside action or at least some reasonable pause
  • The next couple of weeks will tell you in which scenario we are by either accepting or ignoring the EXHAUSTION

Saturday, October 31, 2009

Are we there yet? (update)

"When TIME and PRICE aligns CHANCE is inevitable"

We could be there but don't forget that even in 1938 we had another move below the 38% (SPX1000-1030) before finally hitting the 62% (1200 ish , maybe around Jan 2010) and then turning down for good....
We need to keep an open mind for both sides in an situation where it seems that time and price have aligned.

Wednesday, August 12, 2009

Vix Squared Echo analysis and Long Term Pitchfork scenarios


Here we just want to show what technical damage the "new bull market" has to overcome to prove himself or in other words how things have to be different this time to reconcile with the spin of the "main street view".....

Friday, June 12, 2009

Bear Market Rally

Pls see below that after a waterfall crash like the in 2008 or 1929 a bear rally can easily run 22 (would translate into early AUGUST 2009) weeks and gain 48% (achieved).

In 1930 this was exactly the time when sentiment remembered the preceding bull and believed that the crash was just an anomaly and that the NEW DEAL, Bail outs & FED had regained control.

Even speculation and leverage was returning..........

It all reads like the textbook Elliott Wave description of a WAVE 2 aka. "THE PHONY" .

We don't know how long this one will run from a timimg perspective, but we do know that a correction followed by another surge or a deep dive from here are both within the realm of possibilities.