Showing posts with label OptionSkews. Show all posts

Saturday, January 21, 2012

Mr. Market seen through the lens of Apple

Apple is the ultimate Alphadog in this market. Apple dominates the Tech sector, the optionflows and should lead the market either way. So waht has Apple to tell us....

Medium term: 
Expect some painful correction in a couple of weeks (6-8 ?). The Structure seems developped and probably only needs some final push to mature.
Short term:
we could expect a pause/correction or see a case where the overbought situation leads to a upside break out and thus to some action on the upside. This could develop another neg. Divergence which would eventually trigger the medium term scenario.
Further hints for a short term 'melt up' can be found in the OptionSkews over time. As of now the downside is already priced in which should be bullish.
When we look at the Skews over time we see that a correction started to be priced in over the last weeks. We had a similar situation after x-mas when a small correction was also priced in and run over. This time it is even more pronounced because we find the same structure in the 1 month skews and in the 3 months (bottom chart).
Bottom line:

  • maybe a short pause.....
  • followed by a potential melt up....
  • which will turn out to be a fake upside breakout.....
  • that will lead into deeper correction

Saturday, January 7, 2012

CallSkew vs. PutSkew

As of friday night the Spyder Optionchain for options expiring in 43CD we find the following distribution of paid option premia over a range of historic standard deviations.

Each point on the graph depicts a data pair with a price (as % of underlying, ie how much does it cost to buy the option in %) and the amount of standard deviations the market has to move in order to make the bet profitable (before cost, a.k.a. 'getting in the money').

The peak of the chart is the price at which the market only has to marginally move into my desired direction in order to get in the money.

As of friday we do notice that the distribution is skewed to the downside, meaning players have paid more to get hedged. This works as a contrary indicator where you asuume a hedged position to be bullish. I define the hedged case as the 'PutSkew' (or the reverse as the 'CallSkew').

This has to be seen in a dynamic context where we monitor the day by day developments of the Put- & CallSkews. In this current case we observe a deterioration of the PutSkews which indicates a foreseeablee exhaustion of the bullish case, which in turn supports our overall assessment. 


Saturday, December 24, 2011

Yearend Post

We expect Santa to stay on for a couple of more days.
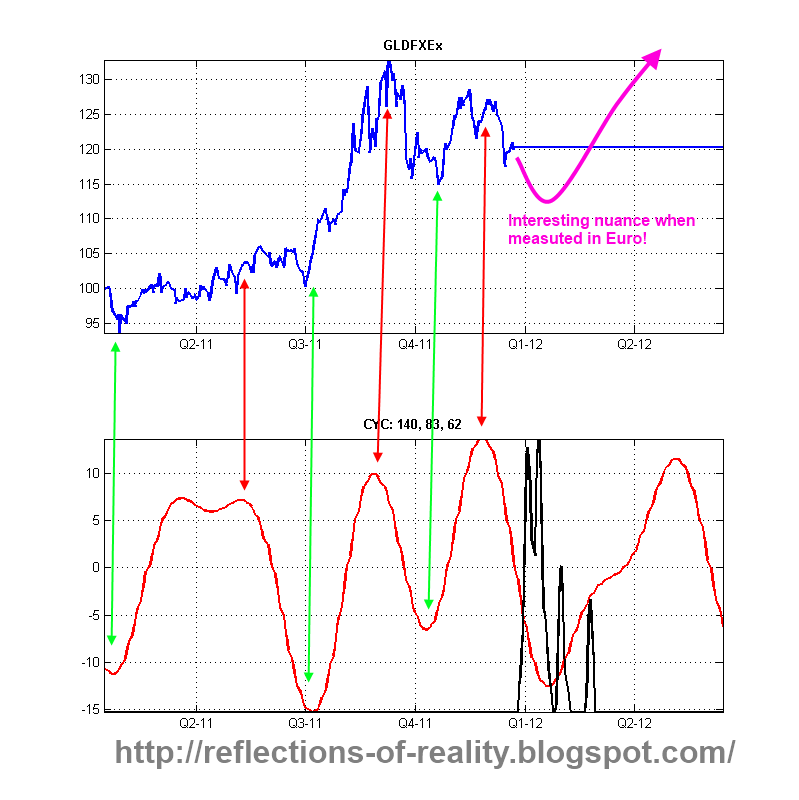
 Gold should jive nicely with our Bradley outlook.
 ...although the picture looks slightly different in Euros.
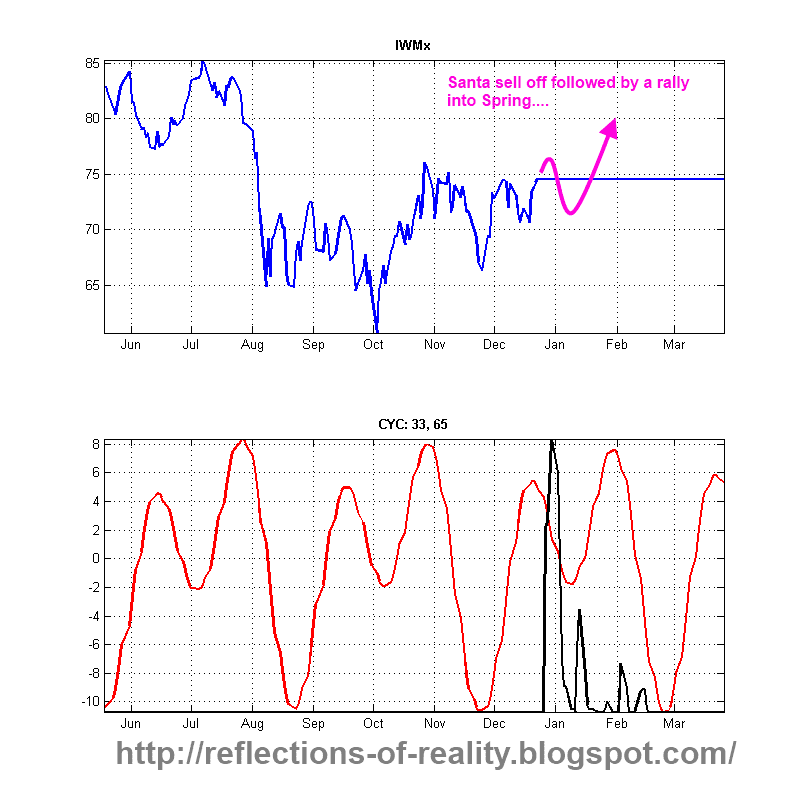
 The Small Caps had their yearend seasonal out-performance.
 Silver will follow the risk trade.
 The Euro is poised for some bounce in Q1.
 Gold gets in position....
The Small Caps are getting rich....
 The Skews seems to support the above.....
 Gold is getting in position....
 Small Caps might have some air left ....


The above fits also into the picture where our VIX_OSC is getting Overbought and seems readyfor some Jan. bear action....
Merry X-Mas and a Happy New Year!!

Friday, December 23, 2011

Option Skews: Methodology

It's time to bring sth. new to the selected group of 'REFLECTIONISTAS' a.k.a  my readers.

This time around we will look at optionskews and their symmetries. Below you will find de-trended Option premium term curves for puts and calls. We usually pick a strike that is close ITM-in the money- (proxy for ATM) and compare the option premiums along the future expirations. We do the same for Puts and Calls. In a perfect , read theoretically efficient market the Vola (and thus the premia) should look alike for puts and calls. Only if some big players bets one side in size will we see differences in premias. For visual reasons we decided to adjust & de-trend the data in order to highlight these speculative positions. Sometimes the differences are bigger than others => read stronger signals.

Dependent on the usage of the underlying as a direct speculation vehicle or as a simple hedging tool the 'Call'-bias (green line on top of the red line) has to be interpreted as bullish (spec. vehicle) or as bearish (hedging vehicle).

Below you find the analysis for the SPYDER which has clearly been a hedging vehicle and thus lets us interpret 'Put'-biases as bullish (and vice versa).

Each term curve is a snapshot of a certain pivot point in the market that relates to the pivotchart at the end (be guided by the numbers).

As of Dec. 19 we don't see any strong conviction towards a Santa rally and therefore will treat Santa with caution.