Friday, April 30, 2010

China seems ready for a tumble

FXP: levered China Short ETF
FXI : China Long ETF

While everyone is talking about Greece or the PIIGS, let's not forget who profits the most from the globalization. This cuts both ways and it looks like China has peaked first in the pack....as they did in Oct. 2009 while the rest needed up to March 2009.....

Sunday, April 25, 2010

SENTIMENT: Looking ripe for a intermediate TOP..

Our VIX_OSC does NOT confirm the recent Price action...

...the Equity Put/Call activity hints at an extreme lopsided (read bullishly lopsided) bias on the CBOE & ISE exchange...


...and BARRON'S is ringing the BELL for the Top this weekend !


Saturday, April 24, 2010

Exhaustion Watch (Follow up)


SUSI WEEKLY UPDATE & EXHAUSTION WATCH

EXHAUSTION WATCH


  • look at all these 90+% Correlations of the Large Traders to Price which usually tends to run high into the 90ties before it turns, i.e. we see a very mature situation here
  • only SRS, EEV & DUG (Energy and Real Estate) have already started to develop neg. Correlations
  • same of those correlation have been posive for up to 27 days (SKF)
  • we also see some deteriorations of those high pos. Corelations like at DIA for 21 days now, which means someone is trying to sneak out here through the back door
  • some of the weekly TDSQ (Tom DeMark Sequential counter) have been up and running for 10+weeks which is a lot and indicates maturity of the trend


SUSI WEEKLY


The Trend is up until it breaks! Given that we are close to the impotant 61% Fib Line of the entire 2007-2009 crash and the fact that each and every trader is looking at this level in a 2nd Presidential Election year right before "sell in May and go away", after having seen a fantastic one way market.......clearly unterpins the current risk in the market!!

Where are the bears ?

Check out this weeks' Sentiment gages (see link on the right side of the blog) and notice the critical state of the bears that resemble levels around cyclical turns......

Breadth deteriorates further...


  1. New High (20 day) deteriorate further
  2. Buying Pressure deteriorates further
  3. Cummulative NewHighs/Lows & Buying/Selling Pressure is still sloped upwards, which means we maintain in the topping pattern for as long as we don't see any New Lows & Selling Pressure develop ....

Friday, April 23, 2010

Timing IDEAS...


Since the S&P broke the 1150 we said back then that we should prepare fro 1226 (FIB 61.8% of the entire crash). Now that we approach this price target we need to have a look at the time dimension which hints at early May with maybe some sectors rolling over a little bit earlier.
Always bear in mind, if Mr. Market can push through 1225 then we can go much higher!!!


Sunday, April 18, 2010

SUSI WEEKLY UPDATE


Apr. 16 really made a difference, because ....
  1. it triggered a host of Weekly CTI's to flip (see extra column in the table).
  2. Pair this with a plethora of wide range outside days to the downside ...
  3. ...plus the fake alerts / failed breakouts (see earlier post) that all came with tremendeous volume explosions in highly levered ETF and ...
  4. ..this on top of biblical Sentiment extreme

...you get the picture.

So the 6 million dollar question will be whether we'll see follow through on Monday in order to confirm the GS masacre friday.... (my humble mind wonders whether OBAMA has the balls to sacrifice GS to the GODS of the midterm election...knowing that this could affect more....on the other side he stands with his back at the wall, like a cornered tiger!)

If the confirmation comes then expect some downside action into 1-2 week of May. (Some of the key ETF's show the next set of TimeCycle Clusters there.)

If it doesn't then we wait for the next even more extreme extreme.


Saturday, April 17, 2010

Exhaustion Watch & Fake Breakout Watch

This week after Friday's GOLDMAN story, Mr Market seems ripe for some pause. This is another of these endless examples where NEWS seem to follow Price and not vice versa like most fundamental analysts claim.

Anyway the SEC picking on GS feels very strange, after what the US Gov't has done to prop up the Banks and in particular GS...

The most amazing piece of news was that GS actually started shorting the S&P500 Future aggressively around 1200 according to zerohedge.com by dragging down this Index with their own news.......


The Market is super extended like on steroids, but on the other hand who knows what the crazy do, drugged up with easy money.....

The 2 enclosed Tables speak for themselves....(check out the Sectors!!)


Friday, April 16, 2010

2003 and 2007 had a similar Volume Pattern....


Pls note that in case that the current neg. Divergence in the relative Up-Volume sticks, we should expect at least a couple of months of consolidation - think 2003- or be at the beginning of something like 2007.

...more Sentiment Extremes

Our workhorse Sentiment Indicators of the VIX_OSC family are both showing the same contradicting story where the price goes into parabolic mode that is NOT matched by the VIX.


New HIGHS & Buying Pressure are not supporting the MOVE into the APRIL OPEX

The 1 months New Highs (top of chart) as well as the Buying Pressure (bottom) are not supporting the Nirvana case that the Price curve or here the Deviation from the 50MA (MOMENTUM Inicator) show....


Our deeper Buing Pressure 2 signals that we reach Exhaustion Extremes again with the potential to develop a neg. Divergence in this Indicator which should be a powerful signal.....

ZESTY EUPHORIA: OPEX anno domini APRIL 2010


Either we are entering a temporary Nirvana a.k.a. PARABOLIC UP MOVE (with a later bad ending) or we see the bad ending soon, given that we are at the 61.8% Retracement of the 2008 Crash.

We are watching History in the making....

Saturday, April 10, 2010

SUSI WEEKLY UPDATE


Brazil, TECH (SOX), Silver, Bonds & OIL seem ready to flip.
All these Sectors have been key leader !!
Let's see what next week brings.....

Exhaustion Watch

BRAZIL, EUROPE, S&P500 & GOLD and Silver !!!

All seem very exended and should need some rest fairly soon, unless it is different this time.
We don't know how much longer the Bull can run from here or whether he will only take a brief breather to run even higher, but what we do know is that he is running red hot and that the Ice gets thinner and thinner....


Buying Pressure & 20day New Highs are fading....

The Bull gets tired!!

Once both cummulative Measures (see graph in grey and brown) start to turn down, driven by re-emerging Selling Pressure, the bears will get a new chance.

Friday, April 9, 2010

What could be a could time for a break ?

Our TCS (TimeCyclesSpikes) Fibonacci Cluster Analysis hints at Mr Market hitting another crossroads.


Now & April 18 will be next high probability time windows where Mr. market can turn or decide to run further...
Ignoring these "energy fields" has made the BULL only stronger, but at some point he needs to rest...
Also have a look at the Corporate Bond Market (LQD) which has been a leader all thee way up.
Where Bonds go , there the Spyder will follow...


Thursday, April 8, 2010

The fairy tale of GOLDILOCKS

Once upon a time confidence returned to the MUTUAL FUND Retail Investor and he started investing again in a Markets that seemed safe again...

...therefore he liquidated his LIQUIDITY GOVERNMENT "ULTRA-SAFE"'s at a lightening speed....
....to also invest into corporate risk again hoping that the bottom is in and that all those good corporate names would start investing into capex again and find all the credit they needed in the structured ABS and/ or the short term CP Market...
...or directly in the BANK CREDIT MARKET, now that the Banks lend again to consumers...
...and Corporates.
Let's all pray and hope for the happy end.

Sentiment: ISE & CBOE are telling the same story...


Pls find above 2 charts from different exchanges but with the same story. Both are depicting the Equity Options (excl. Index Options) Put/Call Ratios (or in the ISE case Call/Put; I adjusted the axis accordingly to make them comparable) and usually the 10day MA is a good gage to access the situation.

What do we see?

EXCESSIVE Call Buying (bull trades) relative to Put Buying (bear trades or hedges) at levels not seen since the HIGH in 2007.....

You draw your own conclusions on what that means.....

Saturday, April 3, 2010

Exhaustion Watch


Quick Observations:
  • Do you see Brasil in there, which is a proxy for commidities
  • Apple - RED HOT, but is it sustainable?


(pls note that we cut the table differently each week dependent on the content)

Are we entering into a new PARABOLIC UP PHASE ?

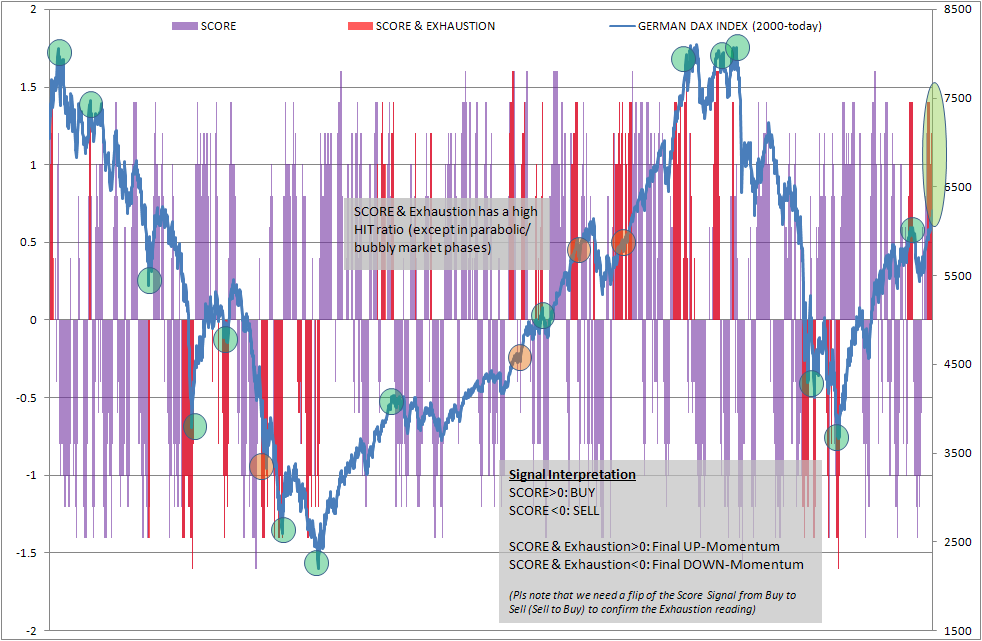
Historic EXHAUSTION Analysis of the GERMAN DAX INDEX from 1990-today:


We thought this week it would be helpful to provide some historical context behind the concept of Exhaustion. There are 1001 definitions of Exhaustion and each analyst is using his own secret recipe, but in the end all measures relate to some kind of measurement of Extremes.
The reason why I show you the 20 years of analysis is because it shows very graphically what exhaustion concepts can provide and what they CAN NOT. (A picture says more then a 1000 words!!)
The quality of Exhaustion Signals is fairly reliable with a slight tendency to be to early at HIGHs (which results from the fact that the LOWS are usually short term events/datapoints, like "MAR9, 2009-THE LOW", whereby HIGHs are more protracted processes).
BUT.....Exhaustion Signals have one significant shortfall, they don't work in parabolic/bubbly markets which are characterized by the notion that they simply move on against the backdrop of Exhaustion and ignore OVERBOUGHT & EXTREME readings.
WHAT DOES IT MEAN?
  • We are either entereing a new BULL and will ignore the EXHAUSTION or
  • We will see some serious downside action or at least some reasonable pause
  • The next couple of weeks will tell you in which scenario we are by either accepting or ignoring the EXHAUSTION

BREADTH update


Our DemandPressure2 chart (green line above) has relieved some of the extreme pressure. Usually these spikes lead the market by a week, so we should see some pause.

If we can overcome the extremes without any reasonable correction then we should expect some HOT upside action going forward in this 2nd year of this presidential cycle.

It not impossible, but unlikely (but what's normal these days..)

SUSI WEEKLY UPDATE


The rubberband stretches even further, so we deal with the question how long can it sustain the pressure without breaking....even a bit....

The MOMO is strong which we have to respect, but this looks more and more like a mirage...

....more to follow....

Sentiment update: The Struggle is still on...


Our VIX_OSC (in both variants) is displaying the same story, namely that of a developping tension of the struggle of the BEARS vs. the Bulls.
The next round should now go to the bears that now have to SHOW whether they can break down out of the Triangle of merging divergences.
We sketched out the bullish and the bearish case in the upper chart, where you see that in each case the resepective winner has to manage the break out.....