Sunday, August 28, 2011

The Institutional Portfolio still needs some bounce to relieve the extreme OVERSOLD condition


Gold Flame-Out

Gold has the flameout in progress with still extreme values in all gages. Gold might have a retest in the works but we saw similar ones with Silver earlier in the year.

Silver actually once it entered into the flame-out in mayhad to tumble as long as all the excesses were out of the Optionflows (bottom left chart). Compare this with Gold above and you get the picture what could expect Gold and for the same token the USD long Bond and the SWISSIE...

MOMO still has way to go on the downside....

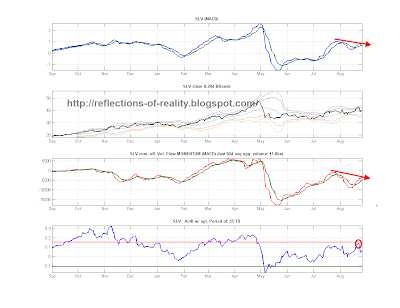
...and the timing model seems to paint a more negative picture too.


CONCLUSION:
It aint't over until it is over !!

Friday, August 26, 2011

Unhealthy Rally could continue

The VIX_OSC still has some room to go up....


...but see this in the context of a NOT improving Liquidity Index.


In summary it means that the final bottom is not in yet.

Wednesday, August 24, 2011

Sunday, August 21, 2011

Liquidity fades out of the Market - Tech edition


Correlations move together in a BEAR Market

All Asset classes move in sync or i.o.W. the correlations move all to ONE.
See the pairs below where the correlations grew over the last month. I don't see any order just a BEAR MARKET.

Pls notice that you only see pairs on the chart where there is already a significant correlation. Try to find your own rationalization from a fundamental angle why these pairs HAVE TO MOVE TOGETHER....I lack that kind of imagination.....


A good Bounce could run a couple of weeks from here....

The measures are so extreme that I would expect a bounce soon that could also trigger some correction in Gold and the long bond.


Which way will the Dollar go...

... or better when will it begin to strengthen..

...in SEPTEMBER....


...or will it start NOW....?

Buying Panic in Safehavens

Parabolic moves in the long bond and gold!!! "Be careful IKARUS not to get too close to the sun".
Remember Silver some month ago...expect the same here soon.


Saturday, August 20, 2011

Crash or Bounce ?

The breadth levels are extreme that demand either a relief or a crash.....


Liquidity fades out of the Market


The last 2 times when our Liquidity Index reached these levels the market had a brief bounce on the search to the final low. The final low can come within weeks or months dependent on the re-appearance of liquidity.

Pls also observe that things usually get difficult when the LIQUIDITY INDEX breaks below -50.

Friday, August 19, 2011

Sentiment looks like a 3 PUNCH structure

I : first IMPULSE
II: 2nd IMPULSE
II: 3rd IMPULSE & POS. Divergence in the indicator and final LOW which could be in a couple of weeks


Saturday, August 13, 2011

Bounce reaches first target

Mr. Market follows our ROADMAP with eerie precision. As a target along the way we expected the market to fall through the airpocket and pause at the 38% retracement of the move since march 2009 (click on the ROADMAP link to see).

The tumble was one of the steepest in history (pls see our VIX_OSC) and has changed the character of the market earmarked by 90% up & down days in a back to back sequence. This can only be explained by lots of High Frequency Trading and disappearing liquidity.

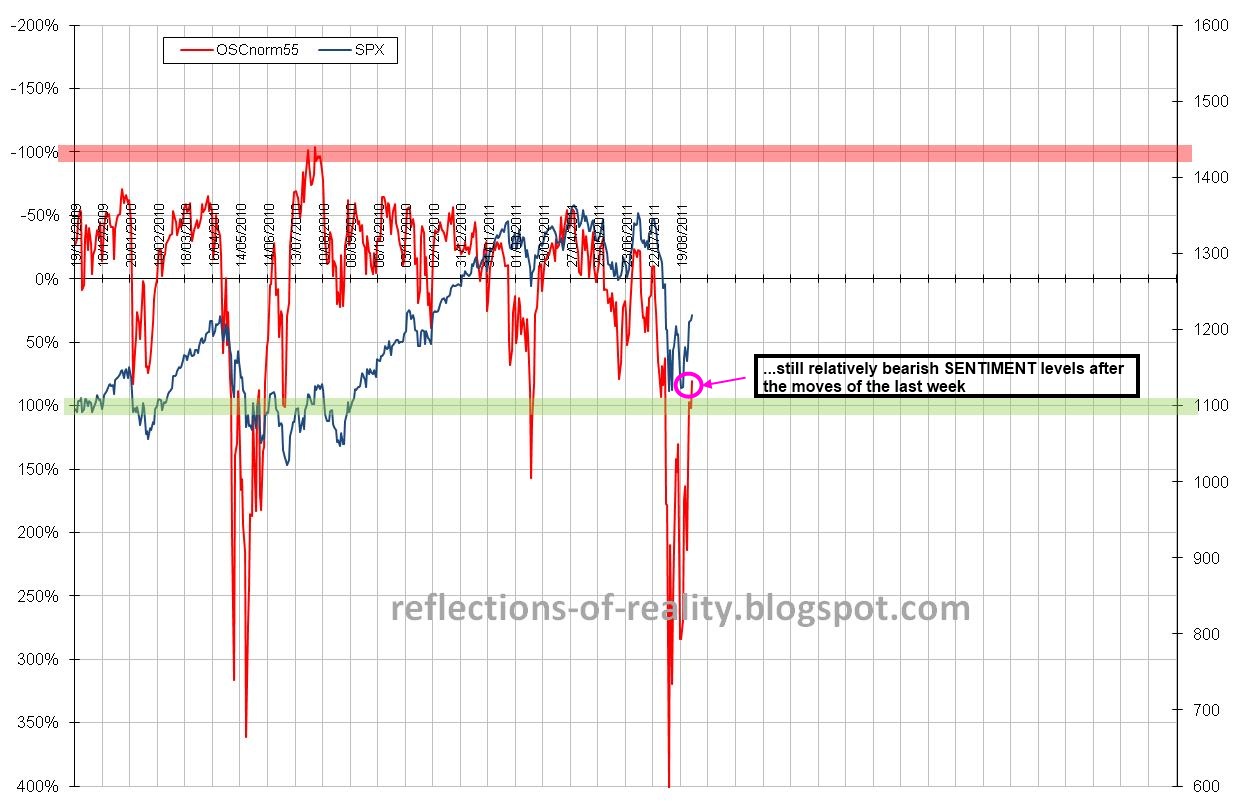
The bounce now has shaped up in a symmetrically fashion with 2 x 71point rallies that carried the bounce right to the 38% Fibo level of the initial impulse down and also back up to the MAY 2011 High (see ROADMAP).

Next targets could be 1225 and 1250 or we could flip right here......

Fractal Perspective: Short-Covering is a trait of a Volatility Compression


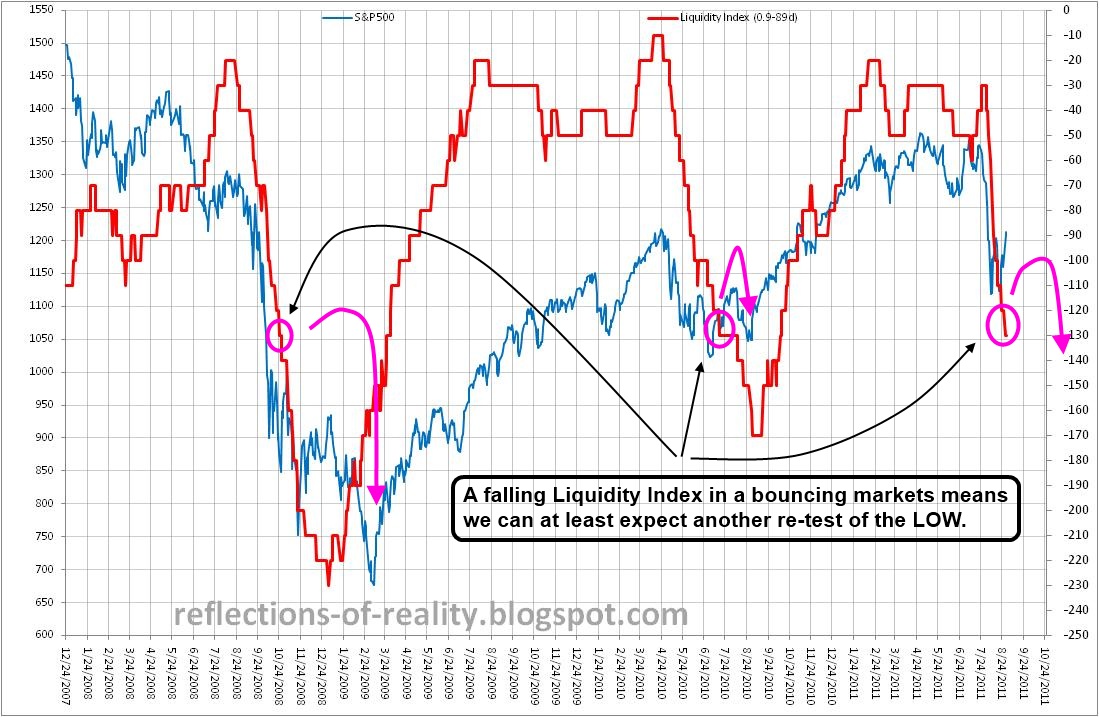
Last week make me remember what I read from Benoit Mandelbrot that "time runs faster in Volatility compressions". I re-did one of my earlier analysis from 2008 when I used his concept to show that something had changed in the structure of the market.
Seeing last week was a prime example of this where we had wide range days back to back, with gut wrenching moves that lacked liquidity and screamed panic.
Above you see True daily ranges of the DOW in % showing a positive reading when the market closed up and vice versa. We define a short squeeze when the market goes through a range of 6% from bottom to the top in a single day.
We observe that when the ranges stay within a +/-4% Range the market is in healthy state of mind. Only when the ranges move into the 6% area like after a panic sell down we know it is a squeeze.
We picked some relevant periods in history to convey our point as you see above.
KEY MESSAGE:
  • 6% Range Short-Coverings usually point to a lower low later in the future. Meaning once the bounces are done the 6% range moves demand re-tests of the low and tend to go lower.......
  • -6% Range down days tend to kick off bear raids
  • WE HAD BOTH !!