Saturday, March 24, 2012

ISE & CBOE data sport neg. Divergences


We looked at the data from the Option Exchanges and found negative Divergences in all 3 charts. We show the Div's in RED and the subsequent price action in BROWN. We see that we get a fairly strong signal with good confidence.


CBOE EQUITY OPTIONS
 ISE EQUITY OPTIONS
CBOE INDEX OPTIONS 

Just look at AAPL and the Banks and you see what's coming

AAPL in a '1999' kind of NEW PARADIGM kind of world of its own.....do you believe it? We on the other side trust in the sutainability of gravity .....
 And then the Banks flying to the moon with AAPL like Call Option buying - AMAZING !!

 All of this against the backdrop of a topping pattern in our VIX Indicators.

Mr. Market has exactly followed the Bradley Model in 2012, which calls for a HIGH around March 23 +/-


Friday, March 23, 2012

Will Gold Top after the Risk Trade like in the past ?

The Prec Metals seem prone for some extra attention, at least for some weeks. The current pattern in the OptionFlows, Call/Put ratios and the Open Interest Strucuture hint this way.

Bear in mind that in the past Gold served as safe have normally in the first phases of Market corrections, before getting pulled into the liquidations as well.


King Dollar update

King Dollar or the inverse the Euro are getting ready for a final boost next week into the 1.34/5 Zone. There the Euro has to decide where he wants to continue his downmove, which would be consistent with weakness in the risk trade.


Thursday, March 8, 2012

Euro Fake Out !!


We stressed the all important Trendline last weekend and Mr Market decided to break and recover also known as FAKE BREAK OUT!

Normally we see fast moves coming from failed moves.......

Sunday, March 4, 2012

Weekly TimeCycles, OptionFlows, Momo update: The High is close

Last week we forecasted some volatilty for the week and Vola we got, but the Equity market didn't falter. This blog has also been in the 'spike it up' into Q1 camp which has worked nicely. Last week we got some crack down in Gold which took place in less than a hour and was not mirrored by Silver (which is normally much more prone to Vola).

All in all we believe that across the Risk Trade we see a rolling exhaustion that will take hold over the next weeks.

==> Medium Term Outlook: Bearish

On the other side bulls die hard thus also looking at unfullfilled Targets in the TIME and PRICE dimension in the GOLD, DXY, EURO, OIL and lukewarm, uncompelling positions in the OPEN INTEREST OPTIONS structure in the Small Caps (IWM), SPY hint at the possibilty that we could see one more reach for the stars.

=> Short Term Outlook: Neutral

Let me illustrate my view from the exhaustion perspective.
Once a Timeseries reaches our formal EXHaustion reading it normally takes a couple of days for the peaking out of the Indicator ('FlameOutPeriod') which is subsequently followed by the topping of the Price of the timeseries ('FlameOut to Price Peak Period'). The sum of both periods usually gives you an idea when to expect the TOP.

For the IWM (Small Caps) we calculated the following:


IWM:
last_EXH = upside Exhaustion

days_since_last_EXH = 19

last_EXH_date =
06-Feb-2012

MEDIAN_FlameOutPeriod_from_EXH_to_EXH_Peak = 4
MEDIAN_time_from_EXH_to_Price_Peak_TDP20 = 39


dates_EXH_Peak    time_from_EXH_Peak_to_Price_Peak_TDP20

10-Jan-2002 65
26-Jul-2002 52
12-Jun-2003 21
27-Jan-2004 48
06-Dec-2004 15
30-Dec-2004 44
03-Aug-2005 27
31-Oct-2006 39
22-Nov-2006 23
11-Dec-2006 11
15-Dec-2006 7
24-Nov-2008 70
26-Apr-2010 63
11-Nov-2010 68
29-Dec-2010 36


graphically this would translate into this:


====> We can expect a TOP around mid March 2012 within the broader range of early March to mid April.
(The numbers for the SPY look similar).


The following charts are different looks at the above from a TimeCycles, MOMO, Sentiment perspective.


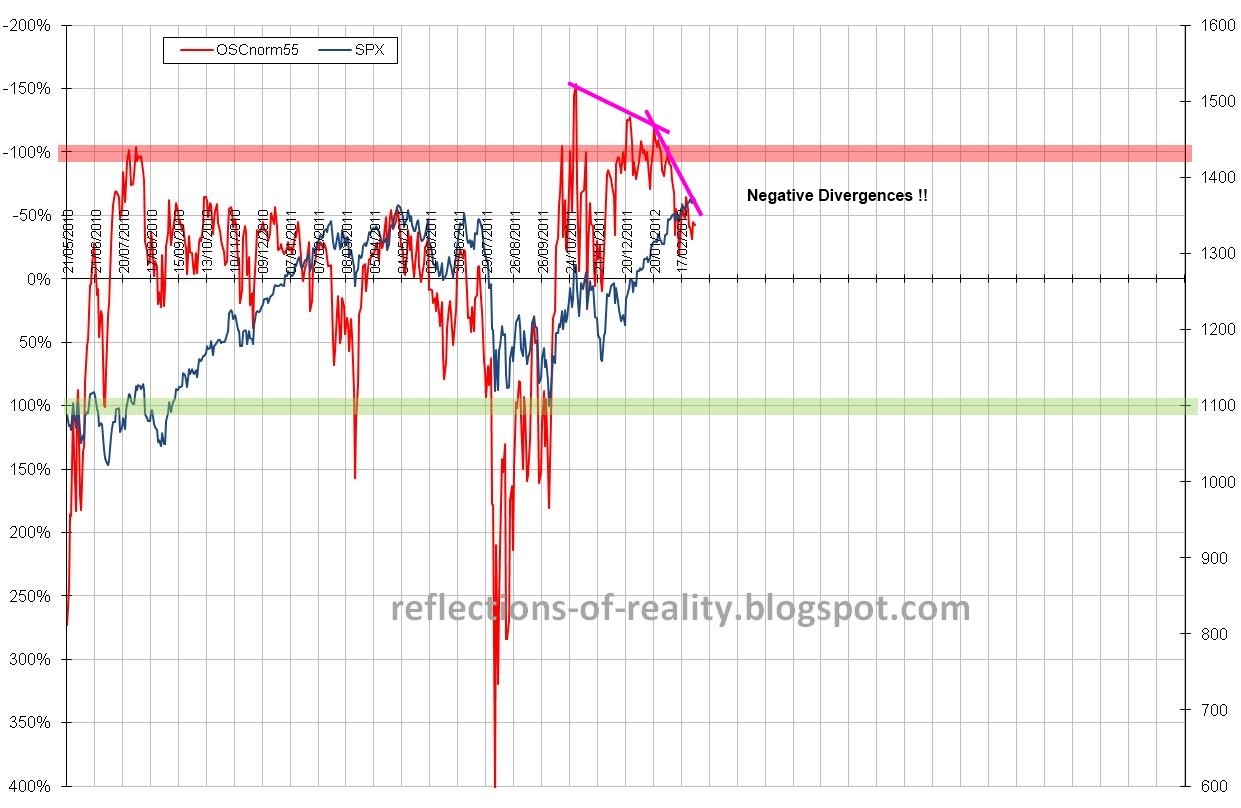
 The damage is done....how much more we can expect in the short term
 Investors in the lev. Bull ETFs  poured some real money into the last run up against a neg. Div. in our MOMO gage.

 Gold didn't reach the Target (yet ?)

 Hot Money and below the Banks had good runs.


 EURO's Open Int. Structure  is directionless
 Gold actually looks promising

 TECH feels rich as does the SPY


Pls. be informed that there won't be any posting the next 2 weekends.
yours
HistoryRhymes

Saturday, March 3, 2012

King Dollar

or from the perspective of his twin sister the EURO....


We  are at a crirical juncture that indirectly affects the entire risk trade and also the question of how much longer the Bull can run.
A weak Dollar (=strong Euro) drives the 'RISK on TRADE' thus a strengthening of the Dollar as obeserved by the falling Euro over that last couple of days (sell the news on the LTRO II & Bernake's: No QE3) could trigger a more severe correction.

The Euro chart offers some reference points to better gage the picture:

see (1):
This was the expected target of the Euro up-move into the high 1.35+ area which can still be reached if we bounce of the supporting trendline (2)

see (2):
key trendline that will determin whether the Euro strength with end next week or whether we will see another run at the target price zone (1)

see (3):
RSI support level for the Euro strength of the last months, which stands around 45.

SUMMARY:

  • We either cut through (2) and (3) and will start the beginning of the RISK unwind trade
  • or we see a bounce back to (1) around mid March 2012
    • which can gain more upside momentum later on
    • or retest trendline (2) again

Institutional BREADTH is deteriorating sharply

Large Cap BUYING PRESSURE is deteriorating....
 ..as is LARGE TECH BREADTH.....
which is normal in a spiking market.

Sentiment paints a topping sequence

Looking at the CBOE S&P INDEX Options, which are the main vehicle to insure portfolios for long only players, we observe that we have entered the Topping process. At this stage and from this end it is hard to tell how much more 'gas is left' in the Bull's 'tank'.
 CBOE Equity Options....
 and ISE Equity Options are supporting this assessment.


Our own 'workhorse' VIX Indicators give us the add'l insight that the Topping process is accelerating or spiking as seen from the steeper divergences.....

 ..and also from the fact that the VIX_VALUE is sporting an anomoly we have NEITHER seen in 2000 nor in 2008.

We feel confirmed with our medium term view that the Market would spike up in Q1, 2012 as a result from LIQUIDITY, LIQUIDITY and LIQUIDITY.
We also still believe that the Bradley Model could be right this year and will not only surprise us with a Spike in Q1 but also with a major move down following mid/late March 2012.