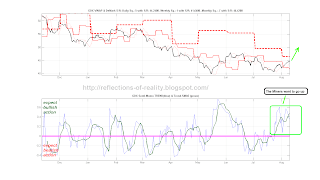
we will be back next week.
Friday, August 24, 2012
Wednesday, August 22, 2012
Monday, August 20, 2012
Saturday, August 18, 2012
Anatomy of the Risk trade
Imagine you were a hedgefund just playing the Risk on/off trade....
Imagine correlations are all converging to 1...
Imagine you were only playing into the safest bets......
This is how your Performance sheet could look like for just playing our VixOsc and the following Etfs.
Ticker RORAC
(ann. Return on Risk adjusted Capital)
Max DrawDown
VXX 135.2% 15.6%
USO 51.2% 6.6%
QQQ 40.2% 5.7%
JPM 62.2% 11.7%
GS 52.4% 16.3%
BAC 57.8% 22.7%
AAPL 69.5% 6.2%
If we get there with simplified models now imagine what the CHEETAHs of today can do...lightning fast, silent and almost invisible....they can produce multiples of the above....
By the way they are all long the risk trade!
This is a new world of investing. The Hal2000s, Algos & Bots are playing the fundamental Investors, the technical traders and play the correlations and spice it up with plenty of hot sauce (VOLA !!).
Friday, August 17, 2012
The air is getting thinner for the post OLYMPIC rally
All Stock Bulls have turned into Bond Bulls. That is far to lopsided...
(courtesy of the
http://www.sentimentrader.com/ )
The Vix FV is getting richer...The VixOSC I+II are both entering the Overbought Zone.
We should position ourselves close to the exit for the next weeks..
Saturday, August 11, 2012
Overbought with no VolaRisk is BULLISH
When we look at the Analysis of the entire Option chains we found sth. interesting, namely that we are currently in a set up where....
- Price relative to the positioning in the Option Chain is Oversold
- ...but the internal structuce within the option chain does not expect any meaningful Volatility
Normally these Indicators are in cync, i.e. when the Market is Overbought you expect Vola. When it is not then the temporary set up tends to get back in sync in a bullish fashion.
The Post Olympics Rally
All seems alligned, which is not surprising within this uniquely correlated market (thx to all you Algos, Bots and Hal2000 out there) .
How far the 'Post Olympics Rally' can go seems uncertain, the patterns still look corrective and some medium term indicators are getting overbought.
But in a market with NO BULLS short covering can run some weeks.....
August could surprise more on the upside
Our Timing models looks optimistically into the remainder of August:
The Euro...
When you look at the Small Caps and overlay the August Stock market Seasonality you see that the next 2 weeks looks good......and this could also translate into Oil.
The Agro Commodities on the other side seem to have priced in the droughts and could top around here in the next weeks ...
Euro Model goes NEUTRAL
The FXE (EURO) is a solid performer over the last year that stayed away from most LONG Extravaganzas and focussed primarily on the Short side with solid success.
Given the high degree of correlations within the RiskTrade the Bulls want to see a stronger EURO (weaker Dollar). Maybe this current break gives some MOMO to the RiskTrade ......Gold was making some start on Friday.
Friday, August 10, 2012
Wednesday, August 8, 2012
Tuesday, August 7, 2012
Crude at a critical juncture
Crude is about to break out to the upside but the break needs more confirmation.
At this stage Crude is Overbought but could but not to a massive degree, which leaves room for both ways.
Crude is also highly correlated to our VixOsc that is still bullish, so we assume that Crude could run further within the positive seasonal timewindow.
Monday, August 6, 2012
Observations for the week
Gold could see some tailwinds in the next weeks.
The SPYDER looks weak. The proce pattern looks corrective and it seems as if this could continue but will eventually resolve in a bearish fashion (...into September).Oil is at a juncture, where it could see more upide MOMO if it break to the upside at this oversold level. This could then form a neg. Div in th TREND Indicator.
...allthough the overall TimeCyles paint more upside....
Subscribe to:
Posts (Atom)


