I made the argument that we have to let Mr. Market tell us when it is time to flip. In my response to Jason's comments I tried to show that Mr. Markets enjoys the path of max. pain for most participants.

When we look at the Market since that discussion we notice that Mr. Market went on for nealy 2 more weeks and approx. 300 points in the Dow and even now we still might need more confirmation to be assured that a tradable correction has begun.
 This is the reason why we began to work on the concept of a flow oriented 'MARKET COMPASS', which is still far from perfect, which still needs more model history to draw from, but which keeps us focussed just on the 'FACT', namely the true money flow.
Our Model for instance tries to isolate data series that are more susceptible to be pushed around by the ALGOS, meaning the have the liquidity in the cash and options to act as reasonable trading vehicle. Maybe our sub-universe is not perfect, but clearly has some solid leadership material.
We have the Banks:
MS,BAC, JPM
FX:
EURO, AUSSIE
Metals/ Materials/ Commodities:
SLV, XOM, NEM
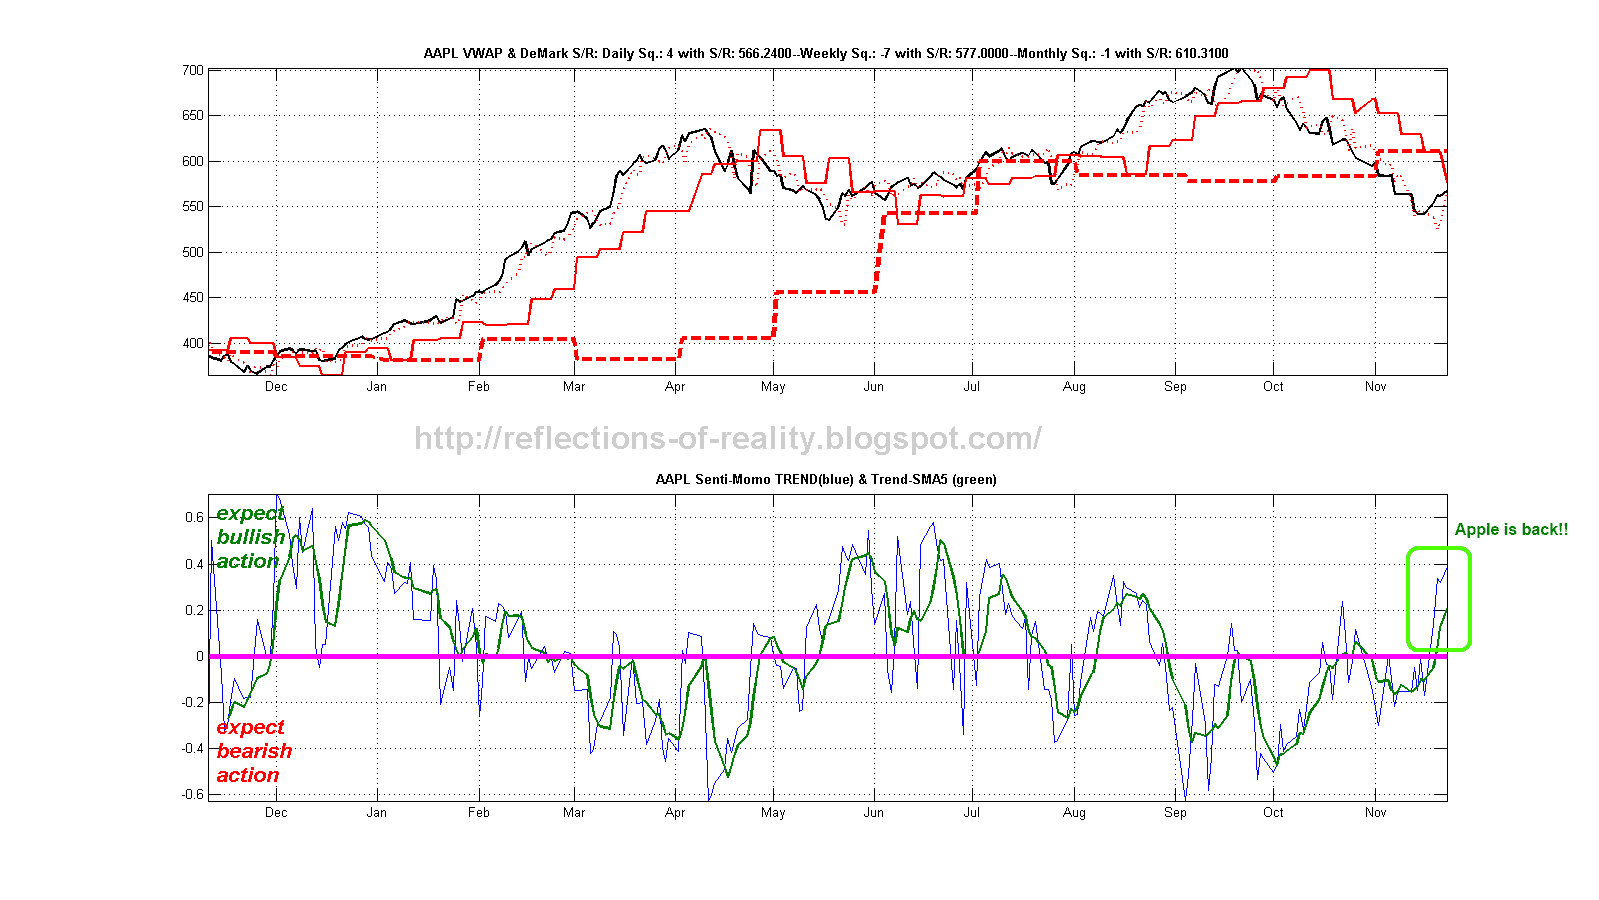
Tech:
AAPL, SMH
Energie:
XOM
Healthcare:
AMGN, JNJ
Small Caps:
IWM
Diversified Ind.:
GE
China:
FXI
Why those ? I don't know, but those show the most consitency with the FLOW+MOMO => TREND approach and surprisingly produce a solid Trend-Signal to trade the Market (SPY).
(The SPYder interestingly enough has so much lead time, that it is hard to confidently trade the swings...)
HAVE A GREAT 2013!
yours
HistoryRhymes

When we look at the Market since that discussion we notice that Mr. Market went on for nealy 2 more weeks and approx. 300 points in the Dow and even now we still might need more confirmation to be assured that a tradable correction has begun.

Our Model for instance tries to isolate data series that are more susceptible to be pushed around by the ALGOS, meaning the have the liquidity in the cash and options to act as reasonable trading vehicle. Maybe our sub-universe is not perfect, but clearly has some solid leadership material.
We have the Banks:
MS,BAC, JPM
FX:
EURO, AUSSIE
Metals/ Materials/ Commodities:
SLV, XOM, NEM
Tech:
AAPL, SMH
Energie:
XOM
Healthcare:
AMGN, JNJ
Small Caps:
IWM
Diversified Ind.:
GE
China:
FXI
Why those ? I don't know, but those show the most consitency with the FLOW+MOMO => TREND approach and surprisingly produce a solid Trend-Signal to trade the Market (SPY).
(The SPYder interestingly enough has so much lead time, that it is hard to confidently trade the swings...)
HAVE A GREAT 2013!
yours
HistoryRhymes