Hugh Hendry is always worth watching for the entertainment value alone and was always worth listening to during the crash of 2007/2008, if memory serves he's more often right than wrong. The main reason he's worth listening to is the fact that unlike many commentators he's 'putting his money where his mouth is' at Eclectica Asset Management.
Sunday, May 30, 2010
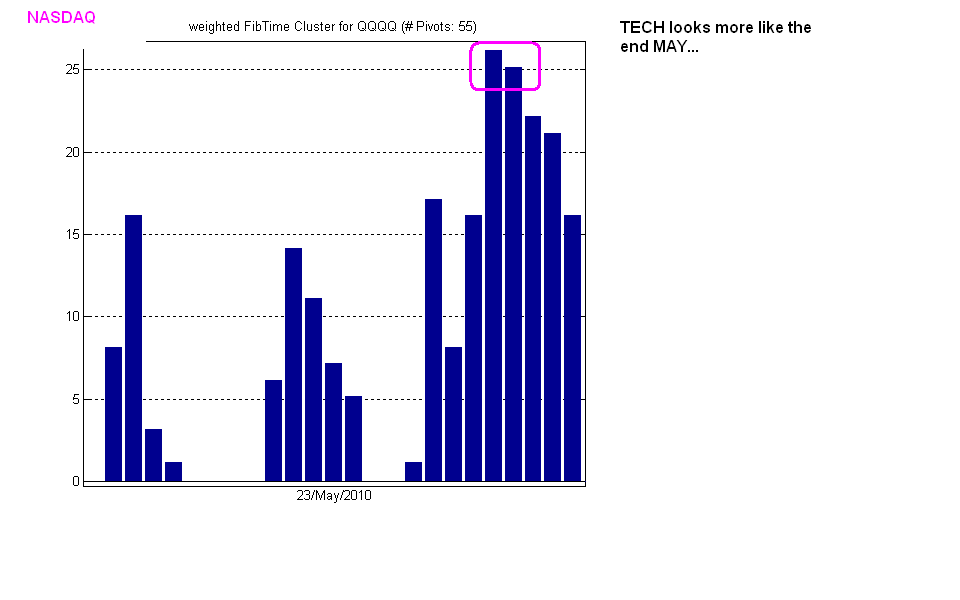
Golden5: Breadth: TECHNOLOGY

WE also ran our Breadth Analysis for a core 50 Institutional MUST HOLD Technology Portfolio and clearly see who is in control of this leading market segment: THE BEARS
The Bulls have to do more to recapture the tape....
ISE & CBOE Sentiment Status: It depends on your where you stand....
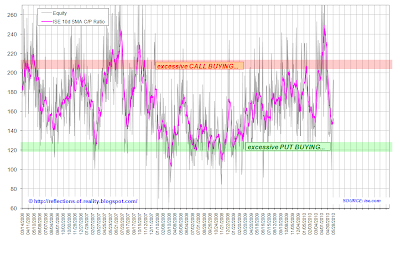

- Both Option Exchanges show similar Equity Options Put/Call Ratios
- Both come from a historical degree of "EXUBERATION"
If you believe we are in a cyclical bull......then you will interpret the P/C data as OVERSOLD and BULLISH
If you believe we are in a cyclical bear......then you will interpret the P/C data as NEUTRAL and BEARISH
If you have an open mind, then you want to see a level of "excessive put buying" as confirmation for the bear or a bounce back towards "excessive call buying" to confirm the bull!!
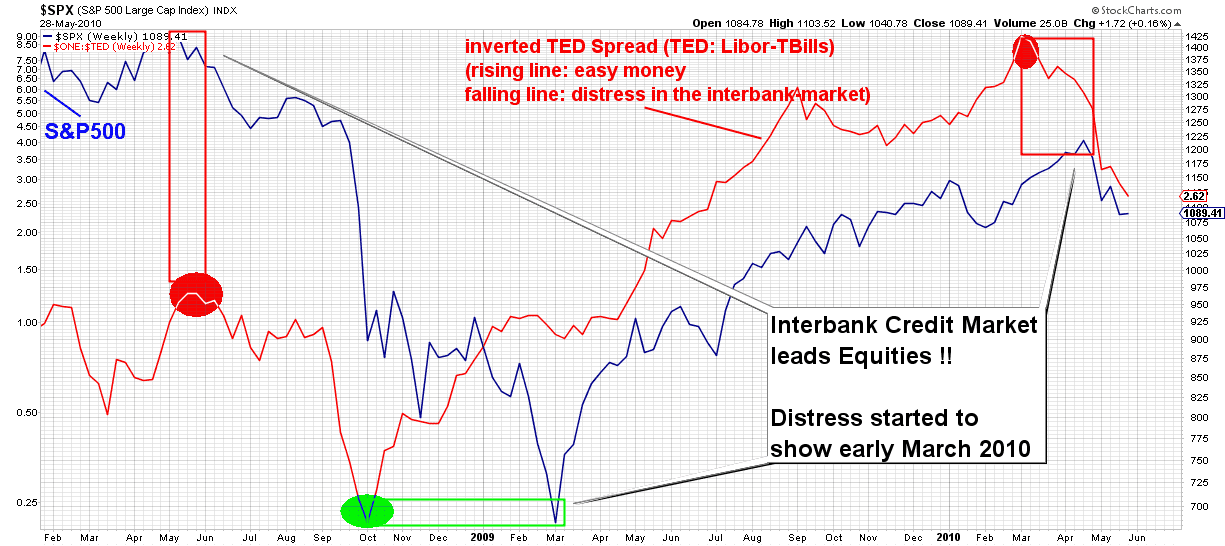
TED SPREAD: Still stress in the INTERBANK Market
The Ted Spread still tells us a bearish story and normally you don't want to bet against the signals from the short term libor market !
Exhaustion Watch
Next week could be very interesting. Our cluster analysis over all ETFs in our Watchlist hint at calendar dates (ignore public holidays!!) therefore Tuesday's open should be telling
 The month is over and we now have confirmed monthly Pivots for most ETFs. Some short term gages like the Active Boundaries or the MACD show contradicting (or leading ?) signals compared to the Monthly Pivots as result of last week's bounce.
I give the benefit of the doubt to the Pivots given that they are aligned with the Exhaustion Signals and also with the Monthly TDSQ (Tom DeMark Sequential) counts that sport some 13-15 extreme readings. Also find that these signals furthermore are aligned with the BreakOut signals.

You find the twighlight zone with Gold and Treasuries that have been affected by the bounce against still strong longterm Pivots. Watch these flight for quality areas to gain more insights next week......
Saturday, May 29, 2010
Golden5: Sentiment Update

The VIX_OSC shows that the strength of the bounce seems questionable ! We need more upside action to change that !

SUSI WEEKLY UPDATE

So far the bounce didn't keep the S&P500 1100 level and still seems nothing more then a counterrend. The extent of the bounce will show the way.
Also let's have an eye on corp. bonds .
Friday, May 28, 2010


Monday, May 24, 2010
Whey are Monthly Pivots so important ....?
Below you see a brief graphical depiction of Monthly Pivots and Tom DeMark Sequential Setups (I simply use the counting rule, if you want to find more google it and you will find a host of sources.....)
 Next we show what are structural features of a bear (and bull) Markets through the lense of the above indicators. You see below 50+ years of the S&P500.
At first sight ,simply visually ,you will notice the strong bear and bull phases.
Interesting for us here is the observation that the we also had in the 70ties bear market a strong intermediary bull campaign which felt like the start of a bull and set up for the most brutal final 10-15month tumble (in terms of the TSDQ counter). This should warn us, given that we just went through a similar imtermediate bull campaign.
(positive values always present bull signals and vice versa).
 The next chart shows a close up of the last 15 yrs and combines the TDSQ's with the Monthly Pivots (once we have a confirmed Pivot in place the signal is valid until we see a countersignal).
Key takeaway here is that the Pivots seem to turn earlier (lead the TDSQ) and that they have poduced fairly reliable signals.
The PIVOTS have just turned a again. This is what we mean when we say the structure of the Market has changed to the bearside!!

Saturday, May 22, 2010
Exhaustion Watch

- We face an Oversold ( bull & long funds) market (see Score)
- Bounce could run a couple of days (see FibTime )
- Medium term trends have been established (look at the Monthly Pivots that usually only come a couple of times a year : M_Pivots (under the assumption that we do not see new monthly HIGHS))
- Medium Term trend is still early days (see some of Monthly DeMark TDSQ -M_TDSQ- have still not flipped and show still extreme readings of 10-15 months)
Bottom line:
We expect a bounce that should not turn the medium term trend indicators. If it does then expect a stronger bull that will try to retest the highs or more....
SUSI WEEKLY UPDATE
 It's a sea of red! The character of the market has changed to the bear side and we will have to watch to what extent the bounce next week has legs. Our own FibTime Cluster Analysis hints at a peak around May30, meaning the bulls have a week to change things quickly. If we just get some shallow counter move then we should open up to more action on the downside.
Sentiment Update


Our 2 variations of the VIX_OSC sport conflicting views (which rarely occurs) which will cloud the nearterm forecast, but still tells us that from a medium term perspective we have to give the BEAR more time.....
Quality Check on our FibTime Tool
On May 10 did we offer the following timing ideas....
http://reflections-of-reality.blogspot.com/2010/05/timing-ideas.html
....and here was happend afterwards in real-time


http://reflections-of-reality.blogspot.com/2010/05/timing-ideas.html
....and here was happend afterwards in real-time


Thursday, May 20, 2010
Capitulation into the OPEX: Trader's Paradise
This looks like a beautiful capitulation into the OPEX. Capitulations don't end moves , so expect a bounce followed by a Retest with likely lower prices.
 The Vix is already showing higher levels...
Our Bias Chart shows how textbook-like the OPEX was played this May 2010. Occasionally when we see spikes into the OPEX it is not unusual to see some carry over effects (for example see (1) from the last cycle) into the first 2 weeks of the subsequent OPEX cycle , which could project further weakness up into early June.

Sunday, May 16, 2010
SUSI WEEKLY UPDATE

SUSI stays her course with :
Long Prec. Metals Short most Equity Sectors/ Europe/Emerging Markets/ Oil
Saturday, May 15, 2010
SUSI WEEKLY UPDATE I

- The long side offers opportunities on the precious metals, Treasuries and on the ULTRA Bear side
- The short side seems to pick on most key economic sensitive sectors like OIL, Materials, Tech, Banks
- The high scores on both sides indicate oversold/-bought markets that can continue their run until they turn. The fact that the DeMark Weekly counters are still far away from double digits indicate more room to run.
- Some of the long opportunities show Correlation Days in the high teens, which means that institutional money has deviated from the main trend for some time to get in position for the next run, which in this case supports the bullish outlook.
- You also see that some nice clusters of signals that are additionally supported by Exhaustion readings and Chart Pattern Signals

Friday, May 14, 2010
VIX Future signals more risk to come....
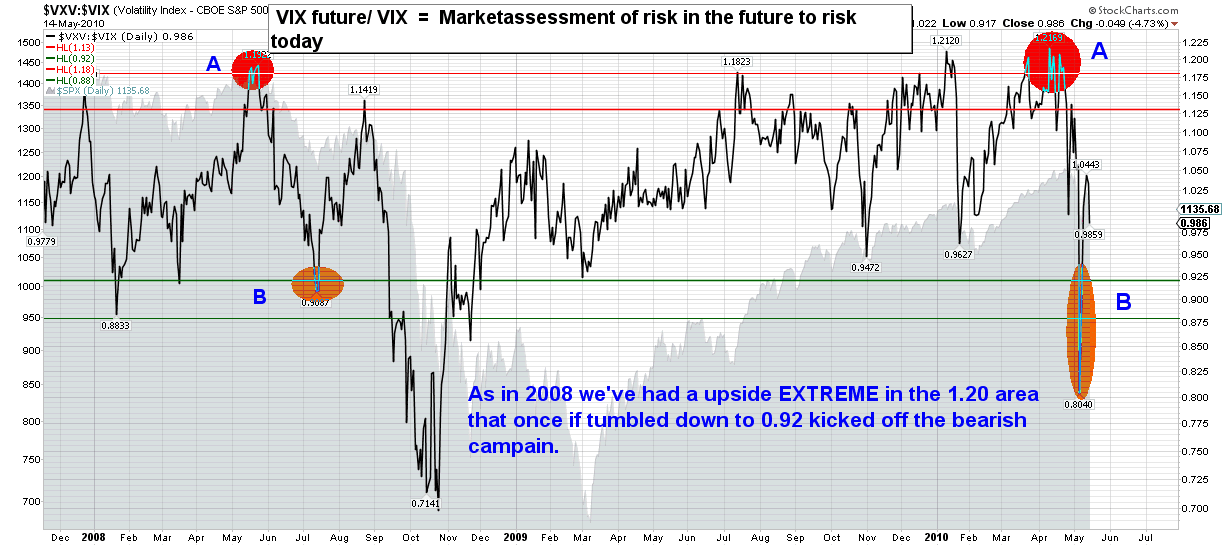 Like in in 2008 we had the imbalance between the peapole betting on a future correction vs the folks betting on a near term correction. Once this Imbalance changed the correction begun. This can be described be the move from point A to B.
Bearish Bias into the May 2010 Option Expiration
PUT/CALL BIAS
 ISE & CBOT Call/Put Ratios:


OPEX Calendar May-Jun,2010

The timing of the current sell down one week before the OPEX, the still rampant complaceny and the current structure of the Put/Call Bias hint at a volatile week next week with a tendency to push a good amount of earlier sold calls out of the money and to pull some recently (see down spike in the Bias chart) purchased puts in the money.
 ISE & CBOT Call/Put Ratios:

OPEX Calendar May-Jun,2010

The timing of the current sell down one week before the OPEX, the still rampant complaceny and the current structure of the Put/Call Bias hint at a volatile week next week with a tendency to push a good amount of earlier sold calls out of the money and to pull some recently (see down spike in the Bias chart) purchased puts in the money.
This all has to be seen against the backdrop of the biblical level of complaceny as evidenced by the extreme up spikes in the ISE & CBOE charts (before the corrections started) and the extreme level of the 89day MA in the BIAS chart (far beyond the 2007 levels).
Too many market participants are still on the same side of the trade and the shorts have just loaded the books with PUTS .....
S&P 500: KISS of Death

There could be more bearish action heading into the OPEX next week....unless we see another weekend bail out !
Bearish kick off still valid !!
 As long as the cummulative lines point downwards will we have to give the BEARS the benefit of the doubt!!
Thursday, May 13, 2010
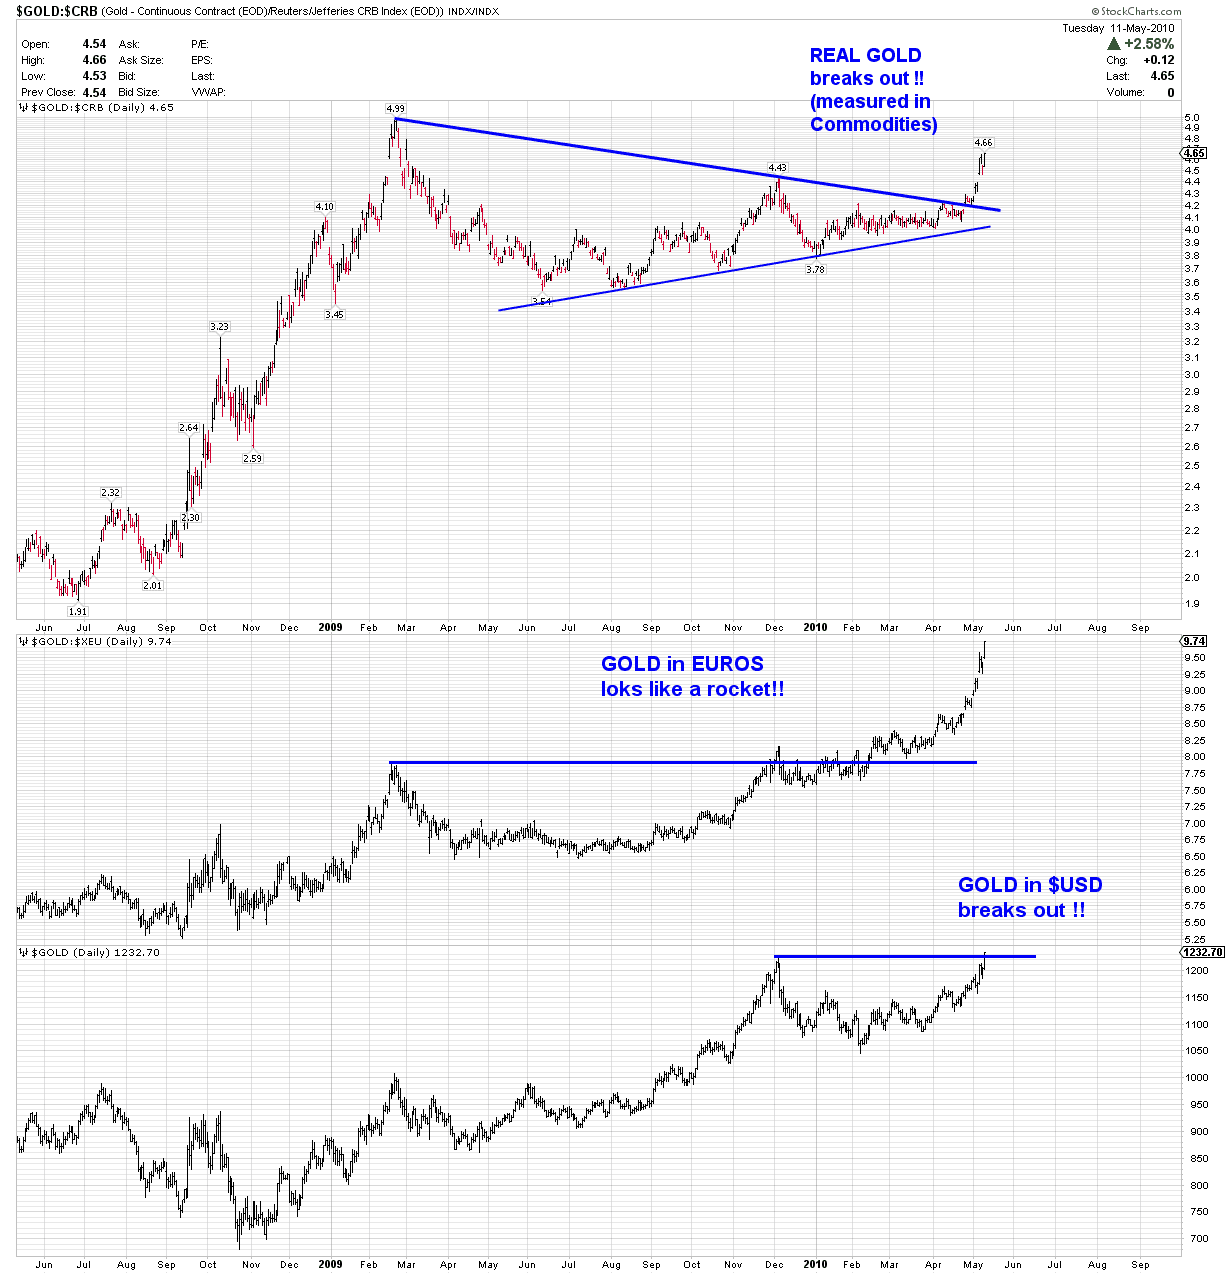
THE TRADE of the DECADE
Everyone is looking at GOLD now that we have broken out to a new ALL TIME HIGH. Gold has been the reflection of the Reflation Trade (easy money !!) since 2000, when the REAL BULL died and nobody noticed his disappearance because of Greenspan/ Bernanke putting the entire market on PROZAG.....
How long can it run ??? Nobody knows, but what we do know is that this chart likes explosive 3-6 months moves once it breaks free....
Could we see another round of consolidation before the effective Break Out ? It's possible as possible as the case that we have just experienced the Break Out....
THE MARKET WILL TELL US !

Tuesday, May 11, 2010
GOLD ETF EXPLODING
look at this
http://econompicdata.blogspot.com/2010/05/gold-etfs-exploding.html
http://econompicdata.blogspot.com/2010/05/gold-etfs-exploding.html
The PANIC TRADE is ON !!
3 lines in the Sand
If the Euro-TARP II program willl stick it has to defend 3 lines in the sand...
GOLD < $1200 (The Panic TRADE)
S&P500 > 1150 (The Asset TRADE)
EURO > 1,2850 (The Future of Europe TRADE)
STATUS on The Panic TRADE:
Mr. Market has just taken out the previous all time high for GOLD las night !! People are desparately looking for safehavens!! (pls remember our comment on the energy field !!)
 Status: EURO
Looks like we have failed!! (unless we turn quickly)

found here http://evilspeculator.com/?p=16132
GOLD < $1200 (The Panic TRADE)
S&P500 > 1150 (The Asset TRADE)
EURO > 1,2850 (The Future of Europe TRADE)
STATUS on The Panic TRADE:
Mr. Market has just taken out the previous all time high for GOLD las night !! People are desparately looking for safehavens!! (pls remember our comment on the energy field !!)
 Status: EURO
Looks like we have failed!! (unless we turn quickly)

Commentary on the Monday's miracle day in the Markets :
Finally, here is a piece of market information that we got through Bianco Research this morning. “According to Bespoke Investment, today will be the third largest opening in S&P 500’s history. The two larger opens share a lot in common with today: [1] Friday, September 19, 2008 — the night before the TARP was leaked to the market (starting with Gasparino on CNBC). Lehman had failed five days earlier; [2] Monday, October 13, 2008 — This was the day all the heads of the 9 largest banks were called into the Treasury and forced to take TARP money as a capital injection ($125 billion in total).” Today’s open was the announcement of “Europe’s TARP,” the equivalent of “America’s Tarp.” As Bianco notes, and the previous two dates should make clear, the prior two instances led to a sharp decline for the next six months, as Primary wave 1 (circle) carried prices lower until March 2009. In fact, the spectacular gains registered on September 19, 2008 were taken back one trading day later. The gains of October 13 were more sustained; lasting all of two days. This latter date is interesting in that the NYSE advance/decline ratio closed that day at a whopping positive 18:1, exactly the same a/d ratio that today’s rally delivered, as shown on the above chart. Regardless of the exact near-term timing, our interpretation of the wave structure indicates that once the current bounce is exhausted, a significant market decline will be at hand.
found here http://evilspeculator.com/?p=16132
BOTTOM LINE: expext volatility !!
Monday, May 10, 2010
Jim Rickards' wisdom
I came across Jim through King World News and enjoyed the interviews with the former General Counsel of LTCM. So here you have a guy who really knows about bail outs.
"....Jim Rickards, who recently has gotten massive media exposure on everything from the JPM Silver manipulation scandal, to the Greek default, was back on CNBC earlier with one of the most fascinating insights we have yet heard from anyone, which demonstrates beyond a doubt why any attempt by Europe to print its way out of its current default is doomed: "Look at what Soros did to the Bank of England in 1992 - he went after them, they had a finite amount of dollars, he was selling sterling and taking the dollars, and they were buying the sterling and selling the dollars to defend the peg. All he had to do was sell more than they had and he wins. But he needed real money to do that. Today you can break a country, you don't need money you just need synthetic euroshorts or CDS. A trillion dollar bailout: Goldman can create 10 trillion of euroshorts. So it just dominates whatever governments can do. So basically Goldman can create shorts faster than Europe can create money." Just wait until Europe finally realizes that the CDS "speculators" had all the cards in the poker game all along. And we hope Europe listens to the man: being LTCM's GC he knows all about failed bail outs...."
h/t Zerohedge
Saturday, May 8, 2010
Exhaustion Watch: Change of Market Character
Our daily Analysis showed this on Friday morning after the carnage on thursday....
 What we can see at first sight is the clear bifurcation of the Market. (I marked the key trend gages for you in white on blue).
Summary:
 What we can see at first sight is the clear bifurcation of the Market. (I marked the key trend gages for you in white on blue).
Summary:
- most trend gages turned (MACD, MONEY FLOW, Active Boundaries Trend...etc)
- most followed the state of exhaustion
- most experienced a 'Candle Signal' (3-5 Bar Signal)
- most also experienced a confirmed break down of the daily trendlines and some of the weekly as well
- some Tickers saw the Money Flow positively and negatively correlating with the price in the -20 or +20 days category whichs means exhaustion
- the TDSQ (TomDeMark Sequential) had already started to (front-) run on the daily counts and is extremely exhausted with the weekly counts (9 Weeks+)

Timing Ideas
GOLD: Next week could be crucial
 Equities: Next week and/or end of May signal some action.


Treasuries: see above
 Potential Scenarios:
 Equities: Next week and/or end of May signal some action.
Treasuries: see above
 Potential Scenarios:
Mr. Market...
- ignores next week and goes deep down into end of May (Equities)
- starts a bounce next week into end of May (Equities)
- accelerates next into end of May (Equities)
- exhausts itsself on the updside and goes vertical (GOLD)
- tests the high of 1225 and fails to break through (Gold)
The Tide has turned....
The Breadth picture as shown by our Demand/Supply Pressure and 20 day New High/Low gages shows the 1. change in character since the Feb. 2010 Lows.
 We now have to give the bears the benefit of the doubt until it changes. This is a textbook change of character of the market.
 We now have to give the bears the benefit of the doubt until it changes. This is a textbook change of character of the market.
VIX ALERT !!!


Both Indicatorvariations ring the ALERT bell. The same Indicators that warned of the possibility of a deep dive last week. Also notice that these Indicators like to develop Divergences which means we see a brief respite followed by at least another or more attacks. We have to interpret these spikes as kick offs for more too come until Mr. Market tells us otherwise.
OIL had a 12.8% down week

If OIL is an Indicator for the global health of the economy or the China growth story then we should get concerned if we don't see a reversal soon. The Charts are projecting downwards to the mid 60ties level for the next potential target.
Friday, May 7, 2010
MAY 6,2010: The Day the STOP LOSS order died
Try to grasp that if Liquidity is unhealthy and decisively provided by ALGO/ ROBOT Traders that pull their bids (:turn off their Machines!!) when things seem too risky and you have a stop loss order that was just triggered and turned into a plain market order, your broker will execute at the clearing price that is theoretically zero or 0.01 like some investors experienced on thursday during those 20min from hell.
Example:
- you're long ABC with a S/L at 99
- S/L gets triggered at 99 and the S/L turns into a market order
- "HAL9000 - ROBO+" decides to turn off and immediately all bids, read willing buyers disappear
- ....so your broker executes at 0.01
- stock prints a 0.01 price
- some bank trading desk just bought your stock for 0.01 and sells it 20 min later for 75
- you got fleeced and someone just had the trading day of his life = so on average nothing happened, unless you believe that there is something wrong with the whole notion of HIGH FREQUENCY TRADING and the entailing systematic risk!!
Morale:
- You will be darn extra cautious before leaving another S/L order with your broker again
- If you need price protection take a limit order which leaves you with the execution risk
- If you need execution certainty place a market order which leaves you with the price risk
May 6, 2010 – The day that will change market structure
Today’s action left us amazed, and we have been warning about this stuff since December 2008. Where do we even start? Yesterday afternoon and evening all the business programming focused on how the markets were in turmoil, and Greece this, and overdue correction that, and fat finger the other thing. They couldn’t even recognize the story, as even the business media doesn’t understand that the markets are a changed structure and beast. The story is not a key-punch error. The story is a failed market structure. The market failed today.
The market melted down and “liquidity providers” quickly pulled all bids. According to today’s Wall Street Journal, high frequency firm, Tradebot, closed down its computer systems completely, as did New Jersey’s own Tradeworx, who was so critical of our silly market structure comments in their SEC comment letter. By the way, if you don’t know who or what Tradebot is, it is the proprietary trading engine that used to be part of the BATS exchange. In fact the reason BATS was rolled out as an exchange to begin with was to lower costs and facilitate trades for Tradebot (Tradebot’s 1251 NW Briarcliff Pkwy Kansas City address is next door to BATS’s North Mulberry Drive address fyi). In the WSJ article Mr. Cummings said his Tradebot system was designed to stop trading when the market becomes too volatile, because he “doesn’t want to compound the problem.” Too bad he doesn’t understand that that was and is the problem. To make matters worse, while some high frequency firms shut down yesterday and pulled their bids, as we warned they would do for over a year and a half, other high frequency firms turned from being liquidity providers to liquidity demanders, as they turned around and indiscriminately hit bids like Randolph and Mortimer Duke.
We are just plain outraged, and think every investor and market participant in the USA should share this outrage. They were sold a lie. How many times over the last year have we all heard that HFT liquidity was a blessing that lowered costs and helped investors, and that it would be there in stressful markets just like the market makers and specialists they replaced were there? How many times have you read in the big media that HFT helped the markets perform brilliantly during the global meltdown in 2008 and 2009? We said it before and we say it now. Lies.
Not so long ago, if our markets experienced severe stress, and certainly a "fat finger", human wisdom would intervene. Reasons for the stress would be ascertained, trading in affected stocks would be slowed or halted, stabilizing bids would be initiated as needed, and severe volatility would be dealt with in a calm and reasoned manner. Today, the human specialist model has been replaced by an automated market maker model. Our market structure has evolved. It has evolved, not by design,?or a well-thought and reasoned plan, but it has evolved to cater to masters of expensive technology, deployed unfettered by participants whose only concern is to squeeze out every last picosecond and fractional cent before they move on to other countries’ markets and asset classes. The for-profit exchange model at every chance sacrifices the protection of long term investor interests for the profitability of serving hyper-leveraged intraday speculators. By the way FLASH orders are still utilized at Direct Edge, but that is here nor there.
Today's price swings in a great number of stocks highlight the inherent and systemic risk of our automated stock market, which has few checks and balances in place. Once the market sensed stress, the bids were cancelled and market sell orders chased prices down to the lowest possible point. Investors who thought they were protecting themselves with the prudent use of stop orders were left with fills that were far away from the closing price. In some stocks like our SAM example above, this was $0.01. We warned of the potential for HFT to behave this way when we met with and showed our regulators the NY Fed study that highlighted HFT's vanishing act around stressful news announcements in the currency markets.
We read this in a recent comment letter to the SEC about HFT and couldn't agree more: "When markets are in equilibrium these new participants increase available liquidity and tighten spreads. When markets face liquidity demands these new participants increase spreads and price volatility and savage investor confidence."
The EXCHANGES’s response late yesterday was to cancel trades that moved by more than 60%. Yes 60%. SO if you bought a stock at $21, put in a stop-loss market order at $20 (expecting to get filled in a market decline of somewhere less than but close to $20), and got filled at $10 (yes this happened and worse), your trade stands! And if you bought this same company’s stock (that fell from $20 to $3 before closing back at $18) at $3 and sold it at $14 thinking you made a big profit, your buy is cancelled, you are short stock at $14, you have a loss, and the futures are green this morning. Inspires investor confidence, right? With this wise remedy and redress by our exchanges, along with their other maneuvers (stay tuned for our coming Data Feed White Paper), one can’t help but be confident in playing ball on this level playing field. NOT.
Today's severe market drop should never have happened. The US equity market had at been hailed as the best, most liquid market in the world. ?The market action of May 6th has demonstrated that our equity market has major systemic risks built into it. There was a time today when folks didn't know the true price and value of a stock. The price discovery process ceased to exist. High frequency firms have always insisted that their mini-scalping activities stabilized markets and provided liquidity, and on May 6th they just shut down. They pulled the plug, as we always said they would, and they even admit it in the papers this morning. We need a new mousetrap. This is not an isolated incident, and it will happen again
Technical Indicators
I found this great summation of the current state.....
The following article is excerpted from Robert Prechter’s April 2010 issue of the Elliott Wave Theorist. For a limited time, you can visit Elliott Wave International to download the full 10-page issue, free.
By Robert Prechter, CMT
Technical Indicators
It is rare to have technical indicators all lined up on one side of the ledger. They were lined up this way—on the bullish side—in late February-early March of 2009. Today they are just as aligned but on the bearish side. Consider this short list:
- The latest report shows only 3.5% cash on average in mutual funds. This figure matches the all-time low, which occurred in July 2007, the month when the Dow Industrials-plus-Transports combination made its all-time high. But wait. The latest report pertains only through February. In March, the market rose virtually every day, so there is little doubt that the percentage of cash in mutual funds is now at an all-time low, lower than in 2000, lower than in 2007! We will know for sure when the next report comes out in early May. Regardless, the confidence that mutual fund managers and investors express today for a continuation of the uptrend rivals their optimism of 2000 and 2007, times of the two most extreme expressions of stock-market optimism ever.
- The 10-day moving average of the CBOE Equity Put/Call Ratio has fallen to 0.45, which means that the volume of trading in calls has been more than twice that in puts. So, investors are interested primarily in betting on further rising prices, not falling prices, and that’s bearish. The current reading is less than half the level it was thirteen months ago and its lowest level since the all-time peak of stock market optimism from January 1999 to September 2000, the month that the NYSE Composite Index made its orthodox top. The 30-day average stands at 0.50, the lowest reading since October 2000. It took years of relentless rise following the 1987 crash for investors to get that bullish. This time, it’s taken only 13 months.
- The VIX, a measure of volatility based on options premiums, has been sitting at its lowest level since May 2008, when wave (2) of ((1)) peaked out and led to a Dow loss of 50% over the next ten months. Low premiums indicate complacency among options writers. The quants who designed the trading systems that blew up in 2008 generally assumed that low volatility meant that the market was safe, so at such times they would advise hedge funds to raise their leverage multiples. But low volatility is actually the opposite, a warning that things are about to change. The fact that the options market gets things backward is a boon to speculators. Whenever options writers are selling options cheap, the market is likely to move in a big way. Combined with the readings on the Equity Put/Call Ratio, puts right now are a bargain.
- In October 2008 at the bottom of wave 3 of (3) of ((1)), the Investors Intelligence poll of advisors (which has categories of bullish, bearish and neutral), reported that more than half of advisors were bearish. In December 2009, it reported only 15.6% bears. This reading was the lowest percentage since April 1987, 23 years ago! As happens going into every market top, the ratio has moderated a bit, to 18.9% bears. In 1987, the market also rallied four months past the extreme in advisor sentiment. Then it crashed. The bull/bear ratio in October 2008 was 0.4. In the past five months, it has been as high as 3.4.
- The Daily Sentiment Index, a poll conducted by Trade-Futures.com, reports the percentage of traders who are bullish on the S&P. The reading has been registering highs in the 86-92% range ever since last September. Prior to recent months, the last time the DSI saw even a single day’s reading at 90% was June 2007. At the March 2009 bottom, only 2% of traders were bullish, so today’s readings make quite a contrast in a short period of time.
- The Dow’s dividend yield is 2.5%. The only market tops of the past century at which this figure was lower are those of 2000 and 2007, when it was 1.4% and 2.1%, respectively. At the 1929 high, it was 2.9%.
- The price/earnings ratio, using four-quarter trailing real earnings, has improved tremendously, from 122 to 23. But 23 is in the area of the peak levels of P/E throughout the 20th century. Ratios of 6 or 7 occurred at major stock market bottoms during that time. P/E was infinite during the final quarter of 2008, when E was negative. We will see quite a few quarters of infinite P/E from 2010 to 2017.
- The Trading Index (TRIN) is a measure of how much volume it takes to move rising stocks vs. falling stocks on the NYSE. The 30-day moving average of daily closing TRIN readings has been sitting at 0.90, the lowest level since June 2007. This means that it has taken a lot of volume to make rising stocks go up vs. making falling stocks go down over the past 30-plus trading days. It means that buyers of rising stocks are expending more money to get the same result that sellers of declining stocks are getting. Usually long periods of low TRIN exhaust buying power.
For more market analysis and forecasts from Robert Prechter, download the rest of this 10-page issue of the Elliott Wave Theorist free from Elliott Wave International. Learn more here.


Subscribe to:
Posts (Atom)