Friday, April 27, 2012

Mr. Market is hoping for some sun in May

Forget any downgrades of Spain, everybody is betting on Super Mario and Heli Ben. So even the Euro catches a bid...
 ...like AAPL brought life back in the Q's..
 ...and OIL likes May.....
 ...but something has to give...Sorry VIX
 ...will the leading Materials warn us of a 'FLASH in the PAN' ?
The DXY and the Euro are in sync for MAY.

 ...as are the small caps.
 Look at Dr. Copper who likes to do some seasonal play of his own around May which aligns with our TimeCycles model.

Wednesday, April 25, 2012

CBOE and ISE expect a bounce

The Index Options - primary hedging vehicles - have already reversed.
 CBOE is in limbo-land....
and the ISE line is approaching a Support-Trend-line.

Base Case: Bounce
Risk Case: failed Bounce and 'Sell in May'

Tuesday, April 24, 2012

Medium term Sentiment turns more brearish and Liquididty could deteriorate soon

Our Liq. Index is usually a leading/ coincident Indicator that seems to top around here. This only indicates a looming top not specifying whether we will see it in the near future of whether we have already seen it....


The Summation_Vix had flipped some days ago (see post from April 11) and continues to project more downside as we enter the 'sell in May' season.

2008 was the last time the Miners were bombed out like today !


Monday, April 23, 2012

Euro rollercoaster ride: What fake move is real...?


Did we have a 1.32 head fake last friday or did we see a breakdown fake yesterday ? Although the bears made their point yesterday the answer is still out. 

Sunday, April 22, 2012

What's the secret sauce in the TREND Indicator

Let's take some random input indicator, be it a MOMO or a OPTIONS or a Open Interest or a EXHaustion or a Money Flow MOMO Indicator and decide how we want to interpret a reading.

Below you find our approach:


We look at an Indicator and observe the following:
  • Is it moving down (or up) = Trend <0 (>0)
  • How close is the current reading to a recent medium term extreme (call it Overbought or Oversold) and calculate a weighting based on that observation from 0% to 100%
We include the following Indicators in our TREND Indicator and give 50% weight to the MOMO and FLOW indicators and 50% to the Options and Option Open Interest ones.

Indicators taken into account:


And this is the RESULT: 

The Case for a BEAR follow through

The Miners seem to need more time.

The Gold/Silver ratio works as a proxy for the CREDITSPREAD and indicates more consolidation.
 And then there is OIL.

The convoluted overall picture will hopefully get much clearer next week !

The Case for an extended Bounce

Following our timing model we see the following in the EURO, SILVER, GOLD and the Small Caps. All models want to see some more weeks of bull action.


Saturday, April 21, 2012

Weekly update: Risk off vs. Commodities on ?

The Euro could be on the verge of some quick upside action. Next week will tell if we can see any follow through..
 The Miners look hopful supporting the story showing from the EURO...
 ...as does Gold...

...and Silver

...and OIL...
BUT on the other side we see that Tech has reversed...


 ..and Vola seems on the uptrend...
 ...with the leading Materials looking bearish

Bottom line:
We can make both cases at this juncture. The bounce can run for another week or the Prec. Metals can decide to ignore the risk trade and become more of a safehaven trade or the Euro reverses again.
Correlation trades might break. Let's see what happens after this wild OPEX week ... that was historically one of the most bullish weeks in the season and wasn't.

QE or NOT will be the question for the weeks to come unless you believe that a fix for Spain is in.....which we don't!

Bullish argument of the week: THE EURO

The TREND indicator has turned up (Thursday's chart before Friday's up-surge close to the weekly DeMark trendline).
 And the Cycle chart foresees a LOW right around here with a 3-4 week up bounce conceivable.
Maybe the Bounce has more tricks up his sleeve or maybe the EURO disconnects from the RISK TRADE.
We will see next week.

Golden5: Breadth has reversed down

The BREADTH of the large Cap. Institutional Portfolio has reversed down...


 ...as has the BREADTH of the  Institutional large Cap. Tech Portfolio

As you can see from the history it doesn't happen too often.

Thursday, April 19, 2012

Was this the Bounce ?

We promised you a 1-2 week bounce last week which came in the shape of a classic a-b-c correction Pattern.
The Pattern needs to morph into something new fairly quickly or this this market could see some further follow through on the downside. Most key TREND charts (we will provide some updates over the weekend) look bearish medium term.

Monday, April 16, 2012

GOLD milestones

ANATOMY of a BULL:

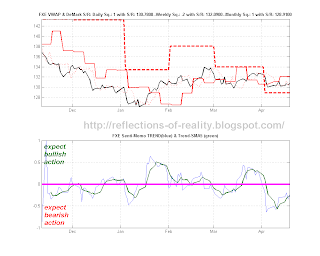
  1. upwards Reversal of the Trend Indicator
  2. Trend Indicator prints positive values
  3. VWAP/ Price captures all 3 Tom DeMark Sequential Trend-Reversal Levels (red lines for Monthly, Weekly, Daily trends) 
Current Status:
  1. upwards Reversal of the Trend Indicator accomplished
  2. Not reached yet
  3. partially accomplished

Saturday, April 14, 2012

Case for the short term bounce

MOMO  (weighted in our TREND Indicator) for Price and Money flows (highly weighted in our TREND Indicator) looks bearish, but the short term IWM optimized MOMO Indicator at the bottom ,that tends to react faster, looks prone for a bounce.


 OPEN INTEREST is medium term bearish.  (weighted in our TREND Indicator)
Here you see our TREND chart resembling the SPY, EWZ, XLB chart.
  EXHAUSTION is also  medium term bearish.  (weighted in our TREND Indicator)

The bounce could run for 1-2 weeks at best.