Sunday, November 29, 2009

Anatomy of the recent Gold Bull


Gold seems to be in solid uptrend, supported by good institutional money inflows. The trend could even sustain a certain degree of a correction without being put in question.
The top and the next correction in Gold will tell the tale.

Saturday, November 28, 2009

SUSI WEEKLY UPDATE


  • Dow Jones & Tech look very bearish
  • ...so does Europe, Emerging Markets and China
  • Gold & Goldminers seem very stretched

Looks like we are in for some consolidation. The TCS (TimeCycleSpikes) hint at mid to late December and January. Key will be whether the correction can develop some momentum to the downside or whether "the printing FORCE" can regain control.

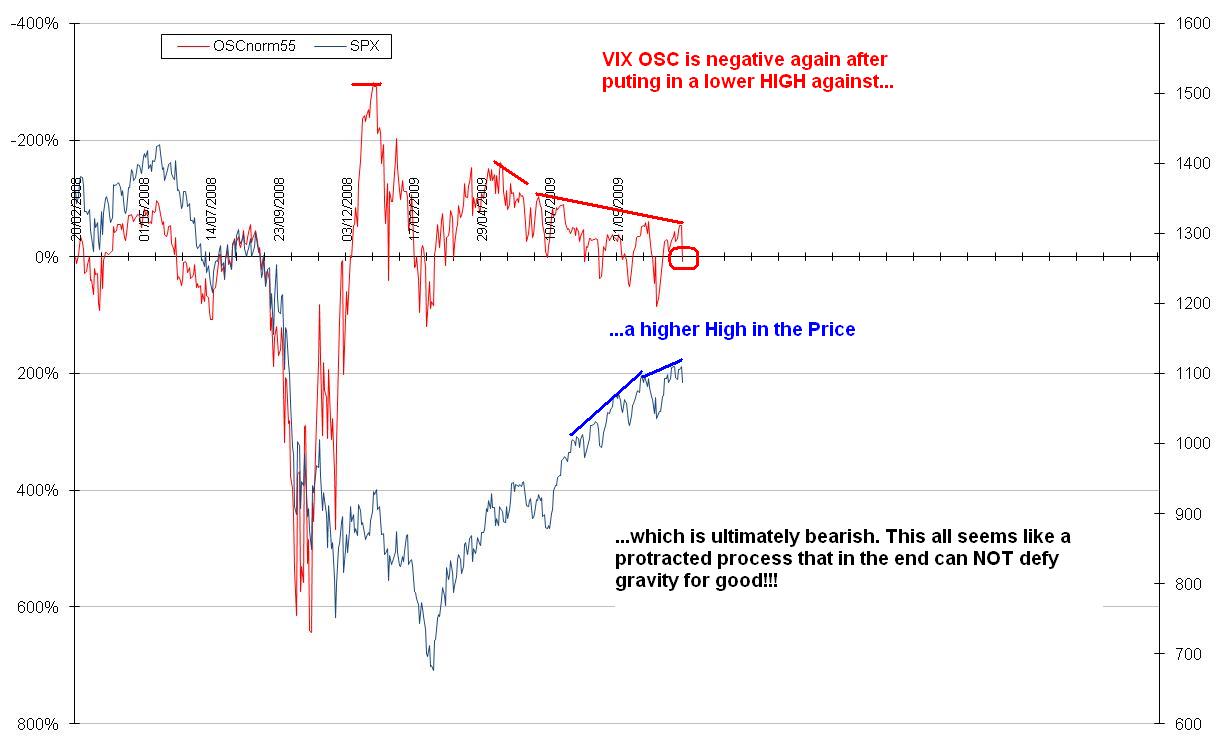
The Market here has a fair chance to put in a top of the bear market rally from March. This only means the the probabilty is relative high but far from certain!

Commitment of Traders

Silver (pls see gold)

Gold seems to turn...

The Dollar looks bullish...

S&P500 might see a top....


Sentiment update


Doo-Bye Numbers

This is exactly why we love the guys at Zero!!

click here for the detailed summary of who is swimming naked when the tide goes out in Doo-Bye
or read below...

============================

Debt:

United Arab Emirates (via Bank of America - Amortization figures only):

Total Debt: $184 billion

of which...

Dubai: $88 billion
Abu Dhabi: $90 billion

Dubai:

Due in:
2010: $12.0 billion
2011: $19.0 billion
2012: $18.0 billion
2013: $ 7.5 billion
2014: $ 5.5 billion

Abu Dhabi:

Due in:
2010: $ 8.5 billion
2011: $14.7 billion
2012: $10.0 billion
2013: $12.4 billion
2014: $ 9.4 billion

UAE:

Due in:
2010: $22.0 billion
2011: $34.7 billion
2012: $29.0 billion
2013: $20.3 billion
2014: $14.9 billion


Dubai World:

Total Debt $26.5 billion
Due in next 36 months: ~$20.4 billion


Creditors:

Of United Arab Emirates (By Origin via Credit Suisse citing Bank for International Settlements):


United Kingdom: $50.2 billion
France: $11.3 billion
Germany: $10.6 billion
United States: $10.6 billion
Japan: $ 9.0 billion
Switzerland: $ 4.6 billion
Netherlands: $ 4.5 billion

Of United Arab Emirates (By Entity via Credit Suisse, citing Emirates Bank Association):

HSBC Bank Middle East Limited: $17.0 billion
Standard Chartered Bank: $ 7.8 billion
Barlays Bank Plc: $ 3.6 billion
ABN-Amro (RBS): $ 2.1 billion
Arab Bank Plc: $ 2.1 billion
Citibank: $ 1.9 billion
Bank of Baroda: $ 1.8 billion
Bank Saderat Iran: $ 1.7 billion
BNP Parabas: $ 1.7 billion
Lloyds: $ 1.6 billion

Other notes of note:

  • UBS speculates that (among other possibilities) $80-90 billion (which is already over 100% of GDP) may be a low figure for Dubai's debt and that significant "off-balance sheet" amounts might explain the restructuring attempt
  • The Dubai government is on holiday (Eid Al-Adha) until December 6th
  • Abu Dhabi's Sovereign Wealth Fund (generally thought to command upwards of $500 billion) may have significantly less available. (Rumors of $125 billion in 2008 losses abounded last year). Bloomberg quotes sources to the effect that Abu Dhabi SWF's AUM has been "overstated, sometimes by as much as 100 percent."

Housing => Credit => Stocks


the pic. tells the story (courtesy of mole from evil speculator)

Gold Roadmap


The always informative Trader's Narrative blog had an interesting comment on the Sentiment in Gold which really got me thinking.....

"Gold Sentiment
Finally I wanted to add a tiny nugget to the
exhaustive sentiment analysis of gold I wrote at the start of the week: the Daily Sentiment Index for gold has now spent more than 17 consecutive days above 90%.

A feat it only narrowly beat in 5 years ago when it spent 20 consecutive days, from early November to early December 2004, above 90%. It managed to create a top at $457 that lasted almost 10 months. And to think, back then it was only 12% above its long term moving average while now it is 23%."


And given my predilection for historical rhymes and the fact that I'm still struggling to reconcile a potential dollar strength/ temporary deflationary case with the developing relative strength in gold, I found this 2004 Rhyme more than revealing.


This potential roadmap align it all
  • Sentiment Extreme in Gold
  • Flow Extreme in Gold
  • retest of the Triangle breakout in Gold
  • steeper 2 months (+/-) correction in Gold
  • relative strength in Gold sustains in the medium term
  • breakdowns of key pillar of the recent rally (see here and here)
  • 1 yr Dollar strength
  • 1 yr deflationary tendencies for the entire Risk trade
This could be a high Probability Roadmap as long as we don't see major deviations.


Friday, November 27, 2009

Banks and Spyders see distribution where the GLD still accumulates

Appollo "GOLD" still on course to the moon


Never forget: Mr. Market needs healthy banks in order to grow

We see a clear divergence btw. the Flows and the Price (grey) which has to resolve one way or the other.

Always keep my My Flow rule in the back of your mind:
"Price" is what you see and what they say , "Flows" is what they actually do

Charting Highlighs post "Doo-Bye"

Remember the Perfect Alignment from Nov. 16. It seems like Mr. Market has read the blog......
Fact is that the this FIBO TIME & PRICE setup is still holding.


Gold seems to defy gravity. Apart from that it seems interesting to observe that the GLD (GOLD ETF) paused or reversed right in the middle of the blue channel, at the top of the minor orange channel and right in my Fib-Zone (based on symmetry comparisons from recent impulses).

And look at our CHINA ETF that seems to have lost its footing or in other words broke down.


.....maybe Mr Market just took "Doo-Bye" incident as an excuse to open the excess valve in order to leave some pressure off. The next weeks will be interesting to follow.

Wednesday, November 25, 2009

This time is different pt.II

If you like to learn more about "this time is different" (pls see last post) then I highly recommend this podcast/ audio interview with Carmen Reinhart (one of the authors).

Here she for instance sheds more light on inflation (....follows 5 yrs after...:2012), or Capital inflow bonanzas among other things....

===========
Carmen Reinhart of the University of Maryland talks with EconTalk host Russ Roberts about the ideas in her book This Time is Different: Eight Centuries of Financial Folly (co-authored with Kenneth Rogoff). They discuss the role of capital inflows in financial crises, the challenges of learning the right lessons, and what is generally true about financial crises over time and place. Reinhart applies these observations to the current crisis, discusses the possibility of the U.S. defaulting on its sovereign debt, and discusses the possibility of financial reforms that might make a difference.

Monday, November 23, 2009

My Roadmap for Deflation and Inflation


Now that more people have started to discuss the Dollar carrytrade, like the much admired
John Mauldin (http://www.ritholtz.com/blog/2009/11/where-the-wild-things-are/), I thought it could be instructive to use the Elliott Wave context to frame a potential Dollar rebound.

The Dollar is so important because if the Dollar is the right hand of Mr. Market then you have to understand what a Dollar short squeeze will do to the risk trade. The risk trade encompasses ("PEAK-") Gold, Silver, Equities, Emerging markets, Commodities and more.


Back to the (simplified) Elliott Wave context:

Working Assumptions:
1) The USD is in a medium term correction (Wave 2)
2) the correction links 2 bearish impulse Waves, with Wave 1 from 2002-2008 and Wave 3 (2 is our correction) from 2010/11 to 2016 and later which could carry the DXY (Dollar Index) to 45ish
3) The Wave 2 corrrection will not be abnormally structured

What kills this analysis:
1) (asset-)Inflation continues
2) The DXY goes below the 2008 Low (let's say if it goes below 70's that we can scrap this analysis)

Conclusions
1) DXY (Dollar Index) can rise into the 90s (EURUSD falls to 1.15-1.20) or more
2) the Rally / Short Squeeze could run for more than a year (Jan/Feb 2011)
3) The overall market could be captured by another unexpected Asset-Deflation riptide (pls see the S&P 500 & the Silver Charts)
4) Precious metals like Gold and Silver could show some relative strength during the panic (but still will be hit hard!! Gold below $700, Silver below $7)
5) Commodities from metals, oil, agro should experience severe liquidations
6) Watch the solvency of the Banking Sector


The Bright Side
In 2011/2 (or hopefully not later) there will be a buying opportunity of a lifetime for Gold, Stocks, Real Estate which will make all people that kept
some buying power in US$ to instant Warren Buffetts of Value Investing.

Bottom Line:
If the Dollar starts to rally and with each Support/ Resistance Area (see Chart) the Dollar captures, the likelyhood of an Echo-Crash rises.
If the Dollar only bounces mildly and continues the descend to below the 70 territory you want to own hard
assets like Gold, Silver and some international Stocks (not dollar denominated!). This would also be the case where you want to expect rising interest rates.

Given the extreme bearish Sentiment and even more extreme price action (compared to Equities for instance), there is a fair chance that we experienced an
"exuberance" on the downside which normally comes in hand with medium term turning point. The daily Sentiment Index (http://www.trade-futures.com/DsiReport.html) which exists since 1987 has never seen this kind of lopsided extremes in Gold, DXY, Silver in the futures markets. The Commitment of Traders (COT) is showing similar historical extremes. In summary we should expect some kind of a short squeeze rather sooner than later, unless it is different this time.....


Key levels to Watch:
EURUSD: 1.60
DXY: 70
Gold: 1000


This Context should allow all "Deflationistas" and "Inflationistas" to provide a framework to realitycheck their believes. No matter whether You follow a Mark Faber with his "we will never see Gold below 1000" call or a Bob Prechter with his "Conquer the Crash2" view, you now have the roadmap that allows for both!!

Saturday, November 21, 2009

This time is different

Carmen Reinhart and Kenneth Rogoff (Harvard): This Time is different (The Book) or just the earlier Paper is a must read for anyone concerned about the current environment.

They go statistically through 800 yrs of financial history and their findings are rather sobering. It's a quick and easy read which you couldn't expect from the subject.

The key takeaway from their unique work is that it would be different this time if the worst were behind us. We'd be smarter than all generations before us and had truly reached some stage of Nirvana where Politicians and Central Bankers have reached their peak right on time to save us from the biggest financial global intertwined train wreck in history. If you believe this is the case that you can continue believing this new generation of NEW DEALERS around the world.

If not.....read the book and think for yourself....


=========================================
This is what Niall Ferguson had to say about it
This is quite simply the best empirical investigation of financial crises ever published. Covering hundreds of years and bringing together a dizzying array of data, Reinhart and Rogoff have made a truly heroic contribution to financial history. This single marvelous volume is worth a thousand mathematical models.
(Niall Ferguson, author of "The Ascent of Money: A Financial History of the World")


SUSI WEEKLY UPDATE


  • We have solid sell signals for the DOW, NASDAQ, OIL STOCKS, AGRO, EMERGING MARKETS, SEMICONDUCTORS, CONSUMER DISC., GOLD
  • SUSI operates like a Thermometer and it tells us that a host of key Sectors are sizzling hot or overheating as we speak
  • The next stop could develop around MID December
  • The PERFECT ALIGNMENT technical Signal from earlier this week seems to have held through the OPX (OPTION EXIRATION) which means sth. in itsself
  • The Dollar seems to try to bottom, if he does it will affect the carry trade, i.e. all risk classes incl. Gold.
  • If Gold can sport relative strength in the correction then you know it's time to buy more....
  • SEMIS and Banks lead the Market down which is bearish for the enxt couple of weeks

Conclusion:

The next weeks will decide on the battle of money printing vs. deleveraging. Anything can happen here!! The overall structure is very fragile. A black swan could emerge but doesn't have to...

The CREDIT MARKET is sending cautionary signals

Thursday, November 19, 2009

Gold could be near a crossroads...


The gold trend is very strong / impulsive, but nonetheless we could see a test of the breakou area or above (1030-1050) which , if it holds, would be very bullish.....otherwise bearish...

Tuesday, November 17, 2009

Monday, November 16, 2009

"When Time and Price aligns....

...Change is inevitable" (Robert Miner)


A dream Alignment that offers Mr. Market to turn ......
  1. 50% Time Retracement (green dotted line) within the 38%-62% Time Ret Band (bold green area)
  2. 50% Price Retracement
  3. 2 Major Trendlines cross
  4. Negative Divergence in the Stochachstic Indicator
  5. Stochastic Indicator is Oversold and seems to turn
In technical terms this could be it, you rarely get a stronger confluence of factors. If they manage to push this through this bad weather front then this hints at a lot of strength and that maybe the bull is real.

Sunday, November 15, 2009

Peak Gold Blow off in the OPX (option expiration week) ?


Watch how this will resolve...
Downtrend in Large Traders Flow <=> Uptrend in Price

How will the Banks do in this Option Expiration Week ?


Banks in the OPX week could reveal a lot......

VIX update: The cat has seven lifes.....


  • The drift to the downside continues (lower highs, more time spend below the ZERO line)
  • ....but the cat is still alive.....anything is possible here but structurally I'd give the benefit of the doubt to the downside unless we see some clear action on the VIX_OSC to the upside

Potential Scenarios for the SPY (S&P500 ETF)

(weekly SPY)


Comments:
  • we have 2 converging major trendlines (from march lows, from Oct 07 highs)
  • we are in the middle of the Fibonacci Time & Price Target box
  • There are Volume Support & Resistance areas aroung 85-95 and 120+
  • the last 2 weeks' surge was on extremely light Volume
  • Pls find 2 potential key breakout/-down areas (for the upside case the upper trendline needs to be broken, for the downside the Fib 38% of the Targetarea needs to taken out)
  • Andrew's Pitchfork could provide a roadmap for the downside or to the March Low retest
  • Pls be warned that once the downside gets accepted we could see some major impulse Wave on the downside......all people will run for the same exit the moment they realize that the rally was fake.....

Saturday, November 14, 2009

SUSI WEEKLY UPDATE


We changed the format in a way that we now included the CTI (Cycle Turn Indicator) in the signal section. The weekly CTI is a leading / coinciding indicator which is supposed to confirm the SUSI Signal. In this function the CTI can act as a qualifier for new Signals or as a warning or confirming Sign for exisiting (previously good) Signals.

Market Comment:
  • Oil/Gold/Dollar are driving the Market and all 3 of them seem tired
  • If OIL & Gold breaks so will the market, given that a good amount of sectors are on the cusp of breaking
  • we are also right in the middle of our 1938 roadmap around Nov. 15 and a S&P target of 1120
  • we also have non-confirmations to the new highs from key markets like the BANKS!!
  • Watch also the trendline from the March-lows. Some have recaptured it some don't!
  • We could be here at a crossroads where Mr. Market will falter or accelerate to the upside
  • Dec 6-8 could be the next stop for either a new high or a first low...

Friday, November 13, 2009

COMMITMENT OF TRADER (COT


GC: GOLD, SI: SILVER, DX: DOLLAR, CL:CRUDE OIL

  • Commodities: GC, SI, CL show extreme Short Positions for the Commercial Traders which usually lead the Market and which are strongly affected by some large Banks that act as counterparts to most commodities ETFs and Hedgefunds (key banks like a JPMORGAN, etc.)
  • GC & SI seems very fragile given the extreme move on the price side and the continued extreme short position: something has to give here fairly soon.....

  • DX seems more dominated outright by the non-commercial traders a.k.a. "large speculators" where we can observe some short covering (although the net position -blue line- is still net short). It could be the beginning of a trend but the move needs more confirmation to call that.

Wednesday, November 11, 2009

Another Chance for a Peak ?


Observations

  • The QQQQ (NASDAQ) blue Lg. Trader's line is not confirming the higher High of the Price (grey)
  • The Dow Jones TimeCycles sport a High % time window which either means a Top , a blow off dynamic or could be ignored....

Friday, November 6, 2009

There will be no update this week.

Dear Reader,
due to family celebrations we will not post a Weekly update.

Serge has a good post describing the current topping process.

yours
HistoryRhymes

Wednesday, November 4, 2009

Why does Silver not foloow Gold ...?


  • Silver is considered as GOLD on Steroids with repect to its Volatility
  • Silver usually leads gold
  • Silver right now is not following Gold to new Highs (Divergence !!)
  • Silver sports Divergences to Gold at turning points
  • SUSI kept a Sell on Silver
  • our SUSI Indicator (see (1)) doesn't seem to develop a higher High, which would have been bullish
  • ...neither does the price action (see(2))
  • we might get some good chances for a low in the future (see (3) TimeCycles)

Could Gold and Silver develop a Headfake ?

Pls see also this post from the ETF CORNER and our GLD flow post from yesterday

Tuesday, November 3, 2009

Nice action in GLD, but expect profit taking


  • An impulsive move that makes the GLD price curve look like a staircase or in Elliott terms like a nice 5 Wave Impulse pattern (3up with 2 intermitting smaller downs)
  • Impulse Pattern are usually followed by at least some form of corrective Pattern
  • The large Trader's curve does not confirm the price action which means that we have seen the price peak or that we will relatively see more Flow into GLD. It's either ... or