Sunday, March 28, 2010

Reflections of Reality SPECIAL: WEEKLY UPDATE 2 & Exhaustion Watch

Pls find the Charts of some of the Highlights this week...


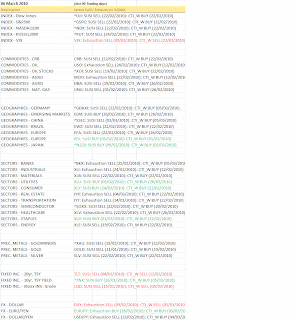
Below pls have a quick looks at our Exhaustion Grid. Pls notice that we've improved the Filters and Indicators significantly. In order for you to better understand our methodolgy we added our EXPLANATIONs further below


Here you will see commentary to the above Exhaustion grid. We numbered our comment for you to follow our flow of the Analysis. There is a bit of everything in here from the leading levered ETF (SDS) that leads the SPY to the clear cut high probability case with the DUG and the EEM up to the potential Rocket candidate in the form of GLD.


The next opportunity for Mr. Market to turn is around NOW.


Bottom Line:
  • The market is SUPER extended
  • the high could be in or taking place next week
  • leading emerging markets & Gold hint at a change in Sentiment
  • bear in mind that we deal here with decades kind of extremes

Potential Scenarios for the next couple of months:

A)

  1. we will see a correction, sharp, deep, brutal that can run for some time (weeks)
  2. expect 10-20% fall
  3. March 2009 lows will hold (S&P500: 850 ?? )
  4. another Bull attack will follow that reaches higher Prices but lower degrees of Exhaustion and thus forms an Exhaustion divergence
  5. ....return of the bear with prices falling below March2009

  1. B)
  2. we skip 1-4 and go straight to 5 because we already have a first degree Divergence in the levels of Exhaustion...


Saturday, March 27, 2010

SUSI WEEKLY UPDATE


Our SUSI is taking a stance here! She seems to have a hunch, let's see how it works out.

Clearly the Market needs a break or pause. The action of the last 2 trading days where we saw profit taking late in the day are indications of that.

Every technical tool in the box is overbought, it feels like that this rally will never end, the bears have all changed sides and allthough there isn't anybody that questions the weird character of the market nobody dares to openly act against this fairytale.

I think ElliottWave's Bob Prechter once said that the market has a perverse streak to always act in a way that causes the most harm to most of the people.
A deflationary setting with falling commodities (maybe with stable Gold) and falling Asset Markets would exactly accomplish that in the current market.

This constitutes the RISK CASE because nobody believes in it and being the cynic I'm I believe there is chance for this to happen!! All these negative Divergences function like rubberbands where either the band breaks (bullish case) or the rubberband flashes back (bearish case). The Divergences tell us that the energy cummulates meaning the reaction (bull or bear case) will be a function from the initially saved energy.

This means in plain english that with each day passing by without a healthy correction the risk for a BIG MOVE rises. Exactly when all feel save the risk is the highest....

(This is also the reason why we monitor all kinds of exhaustion indicators to measure the energy level.)

A quick fall through 1050 on the S&P500 and we have a failed breakout which could turn nasty.

Crude Oil in Euros: How strong is the global economy ?


Crude Oil adjusted for the US$ strength gives us a good idea how real the demand for Oil actually is or in other words whether the Economy is strong and therefore demands crude for transportation, production etc.

What we can see here is that Crude in Euros is struggling or pausing whatever you prefer. This situation will resolve one way or the other and technically we see the development of some near term Volatility.
The Direction is hard to call here, but if crude breaks upside through the RSI Resistance level then we could expect some explosive action like in Apr. 2008 (Inflationary Case).... if it falls down then buckle up for Deflation !! (we would call this technically a failed breakout of the 50% Fib. Retracement level and failed moves usually become explosive moves too)

Market Observations: The Market looks heavy...

1) The VIX Future is hinting at another try for a bear campaign, where the 'playas' buy future
puts and sell puts today

2) Animal Spirits reach another EXTREME, a picture says more then a 1000 words
3) Medium Term Breadth blinks: OVERSOLD, OVERSOLD, OVERSOLD
4) Corporate Bonds will are the ultimate core of the current rally and they look vulnerable

Saturday, March 20, 2010

Money on the Sidelines....

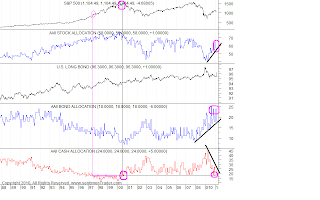
As you see from the chart above, Money Manager Cash allocations have reached the lowest levels since the beginning of the Crisis. Most of the Funds been allocated into Bonds and some to Equities.

The last time we saw a similar level was around the 2000 Peak which can stipulate a bearish interpretation.

On the other side during the 90's bull run it was around 97-98 when we first reached the current level and it took another 2 yrs and a parabolic endmove to finish the Bull.

There you have it, both interpretations are conceivable.

I personally find the former more plausible then the latter because I find it hard to believe that the macro picture supports another 2 yr vertical bull move, but that's me....

Sentiment Update

Our VIX_OSC
a new VIX_OSC variant...

A divergence as shown in both charts indicate a deviation in the option market to the cash market or in plain english they pump up the price, push the Vix down and load on average over time up on protection .....

The next potential BUS stop will be around next week....

Fibonacci Cluster are like Bus stops on the time axis. The Bus doesn't have to stop there by usually the probilities to NOT a bus stop are slim, which means if he skips one you look for the next...

Our next stop is early next week....


BANKS/ Financials Cluster:
S&P500 Cluster:


Corporate Bonds (HG) Cluster:


Exhaustion Watch

Our BUYING POWER2 (SELLING POWER2 on our INSTITUTIONAL MUST HAVE PORTFOLIO) Exhaustion Indicator sports values higher then at the beginning of the Crisis and as high as the level that gave us the last 1yr MONSTERRALLY...

...the same can be observed for our INSTITUTIONAL TECH PORTFOLIO...

Some of the leading ETF's are confirming the above.

Conclusion:
It will take a herculean task to let the Market continue to levitate at these price levels without any kind of meaningful correction.
This Indicator set is a crude timing tool with respect to a concrete day but we should expect a limited upside at a minumum for the foreseeable future.


SUSI WEEKLY UPDATE


Besides Commodities all lights seem on green. One could argue for the leading qualities of Energy here but we have to give the Bull the benefit of the doubt.
Mr. Market played the OPEX more aggressive on the bull side then we anticipated. If we can hold the breakout (S&P500: approx 1150) then we can expect a move to 1250 as a next stop.
On the other side the our friend the bull seems fairly exhausted as all people have allocated to the bull case, therefore we have our doubts about the bullish outlook.
A VIX below 17% this week was a dream come through for all Hedgies to load up the truck with PUT OPTIONS.
Mr Market has to stay above 1150 and get through the end of March......let's wait & see

Saturday, March 13, 2010

Exhaustion Watch

All candidates are main stream or levered alternatives...

ENERGY, TECH, FIXED INCOME....


TIME Projections for the XLF & SPY


As you can see from the charts above the next crossroads will be early next week, then Mar 21 and Mid April.


One conceivable interpretation among many would see a peak around here with a bottom around Mae 21 or Apr 11....


...or a High around Mar 21.....and a correction around April...


Mr. Market will tell us!


SUSI WEEKLY UPDATE

Due to some technical problems there will be no SUSI run this weekend.

The Picture so far this week has not changed and we are still in the expected high probability reversal window with runs into early next week, which coincides with a high level of exhaustion and a negative Divergence in our VIX_OSC sentiment gage and a failed break out at the 1150 (S&P500), let alone the premature equity options action and the ticks divergence.

All this is taking place going into the OPEX.

If the Market can manage to stay above the 1150 then anything can happen and the 1200-1250 must be seen as a next target.
If NOT then better buckle up.......

The Jason Bourne market...

Zero is always a great source and some of Joe's comments go straight into the core of our reflections-of- reality theme......


(from zerohedge)

Themis Trading's Joe Saluzzi once again points out the flaws in the all clear psychology, and that if only we can break 1,150 on the S&P (which we just did), we are headed straight to 36,000 on the Dow (although as we are now in a fully blown melt up as we pointed out last week, we very well might). As Saluzzi says, we find ourselves in a "A momentum driven, fragmented equity market. What we see is a very lite volume morning normally, jacked up really fast by a couple of programs that come in, and then you get this churn most of the day. There is not a lot of conviction out there." And the reason why the market closed above 1,150 (1,150.24 on the last print to be specific - what a computer programmed joke) today as a last minute buy program ramps up: "This market is built on lies and rumors." (a topic previously discussed on Zero Hedge). Technicals and algos rule, and the Fed will take care of all the rest. And the faster one's reactions (on the exit button)the better, which is why if one is an Xbox gaming champion and 18 years old or younger, Getco and Goldman will hire you on the spot. According to Saluzzi, this observation has lead to a new nickname: this is now "the Jason Bourne market, because when he goes into a room, the first thing he checks for is where the three exits are. How do I get out. That's what investors are doing."


Sentiment update

Still a neg. Divergence going into the OPEX...


(we use a modified Vix OSC)

Same level of Exhaustion as late 2007..

Mr. Market is extremely oversold and has reached an exhaustion level only seen twice in the last 2 yrs.

He is also trying to break out which seems hard given the level of exhaustion.

Question of the Week:
Can Mr. Market go into overdrive into the OPEX from these extreme level?

Answer: YES <=> explosive up move that leaves the break out level behind
Answer: No <=> explosive up downside move that leaves the break out level behind

This will be a binary game: volatile, brutal with an uncertain direction!!

Friday, March 12, 2010

Chance 1 for a compelling break out was today....

see the update to yesterday's tick chart...
The Bulls were hoping for a compelling break out, but apparently this didn't happen today. They probably get another chance but don't forget the old saying....

...Failed moves tend to become explosive moves....

Wednesday, March 10, 2010

OPEX showdown is building up

Normally we look for an Equity Option BIAS running into the OPEX that indicates the direction of the to be expected action. Occasionally players get ahead of themselves too early which results in spikes more than a week before the OPEX. Case in point was last month.

Don't get me wrong, a good spike within the 5 day window is a reliable indicator, but this time we are slightly outside these bounds, where they bought large amount of calls -maybe- too early. This will be a tight call......but odds are against the bullish outcome....


Below you'll find a chart of the action in the equity options market (10d average) and you will see that we are approaching the orange neg. Divergence line from Dec-Jan in the lower chart.
Either we respect the orange line and correct into the OPEX (option expiration) or we see a bullish blow off.....


Where are the Ticks going........


Look at the NYSE Tick data (averages as shown above), they are sporting a testbook negative divergence, which could hint at some near term weakness.....

Saturday, March 6, 2010

SUSI WEEKLY UPDATE

This week you'll get another run of our "SUSI classic", where you will find that our SUSI Indicator doesn't see the strength it would like to see in order to completely flip to the long side.
Allthough the CTI indicator follows the bullish MOMO of the last weeks, SUSI keeps her reservations....


On the other side we have the updated SUSI T1000 (which we filtered for Exhaustion earlier) which comes to a similar allthough be it a much more granular conclusion that the latest rally did not sport the kind of internal strength we would like see in oder to be convinced...


Thoughts for the week:
The Small Caps have set the pace with a new high and most likely all the other asset classes will test their highs for the same goal. My best guess (case a) would be a collective break up to new highs that subsequently fails (cannot exlode to the upside, halts, waits and stumbles...) which would be a bears dream. Case B would be a convincing break through which would be VERY BULLISH for the next couple of weeks or even longer. Case C would be a fail without even reaching new highs right at 1st...2nd...3rd attempt.

Commitment of Traders report: Hedgies target the EURO

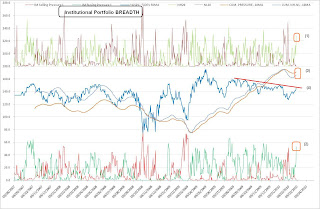
Breadth update: Bulls recapture command!

see (1) :
New Highs 20days cleary signal that the bull are back in charge of the tape

see (2):
Buying Pressure same as (1)

see (3):
the cummulative 10day lines of (1) & (2) have turned bullish again

see (4):
Momentum (MOMO as deviation of the price from the 50 day Mov. Avg.) still points to the bearish side


Summary:
The Bulls have recaptured the tape with a venegance and are in control. The extreme one way nature hints at some potential exhaustion, meaning at Feb 5 the market turned and just went up and never looked back which doesn't have the "climb a wall of worry" kind of feel a healthy move normally has.

Sentiment update: Still a draw btw. Bulls vs. Bears


The next swing could be interesting. Will we see another lower High along the red resistance trendline (see chart) ?
Yes , means bearish...
No, means bullish....

Friday, March 5, 2010

When can we expect a High ...?

Let's start with a single name TimeCluster for the the XLF (BANKS). When we cluster for different timeframes we get the chart below. We now look for overlapping periods as kind of confirmations. If we operate in a harmonic parameter set up then we should find overlapping time zone (but doesn't have to be that way all the time !!)
Finding: Mar 10-15 look like the next opportunity for a High

If we now do this for a market portfolio of key large cap stocks and highly liquid ETF's , cluster an entire week and plot it into a scatter chart you get the following chart.

Finding: We find a clear defined Zone from now (Mar3 to Mar 15). Given that we have already "missed" some days out of the zone this week the probability for the remaining rise....
Important Note:
Each zone has to be interpreted as a high probability crossroads and Mr. Market can follow or decide to ignore, which in itsself has a very strong meaning and says a lot about the state of the market.

Exhaustion Watch

As a bonus for all your patience we will post some specials here this weekend to help you better assess where we are.

Below you will find a brief exhaustion watch that filters for ETF's where we see a negative correlation btw. the Large Traders Flow and Price developping and where the Tom DeMark Sequential Counter shows close to excessive values ( normally targets around 9+ ).


Summary:
The Banks, Bonds and Real Estate look very vulnerable for a least some kind of pause in the near future.


Monday, March 1, 2010

ETF & MUTUAL FUND Flows show a mixed picture....

The Casino seemed to be open and most of the action is short term and/ or US Dollar driven. Yes we see some complacency but also a lack of conviction. Treacherous circumstances !!


Let's start with Money Market Flows that show that greed is back and everybody is scared of negative carry....

The Retail Mutual Fund Flows show a relative weakening, particularly on the Fixed Income side. Fixed Income flows are still positive as opposed to Equity outflows. This does NOT support a solid rally !!
Ouch! Looks like the Banks are experiencing ETF outflows. How does this reconcile with the recent action on the banking side is still unclear...
Fixed Income ETFs still act as Safehaven!
What does the still positive but deteriorating action in emerging markets and commodities mean is also still unclear at this point.

Deflation update: Deleveraging continues

There can be no end in sight if we do not see any kind of credit normalization (i'm not even talking about expansion!!). Pls look at the following charts and draw your own conclusions.

Consumer Credit is still in a free fall...
...as is Bank Lending, there no way to give this a positive spin....
....and the shadow banking area (source of ample liquidity in the boom) is still broken...