
Thursday, January 31, 2013
VixOsc is close to flip bearish
Wednesday, January 30, 2013

Friday, January 25, 2013
The Euro has reached our Target
The Euro has reached our target or better a crucial crossroad. we also added our chart from 2 weeks for comparision.
From here 2 path seem possible as shown in the chart.


Thursday, January 24, 2013
Blow out time for the Bulls?


Sunday, January 20, 2013


Friday, January 18, 2013
Opex pump job into a toppting pattern
Anatomy of a Top:
1-correlations rise: done

2- Option Players getting in position (see neg Div): done

3- The VIX feels 'paranormal' :done

4-Sentiment gets overbought: done

5- pump the market up into an Option Expiration

Thursday, January 17, 2013
Risk is growing underneath the surface
Correlations are rising....


Monday, January 14, 2013

Saturday, January 12, 2013
Warning Signs in the bullish wonderland
When we look at the overall model we see an ideal position of 100% long since the beginning of the year. What is reason for concern ist the amount of negative Divergences in the contributing elements. Particularly concerning are the deviation for the Banks, China and the Euro.
Summary:
NEGATIVE DIV
SMH
FXI
IWM
FXE
BAC
JPM
MS
JNJ
POSITIVE DIV:
AAPL
SLV
NEUTRAL:
GE
FXA
AMGN
Plain Bullish:
XOM
NEM
Pls. see for yourself. There is the smell of an Exhaution in the air, let's see how quickly it materializes.
(all charts and more can be found in SUSI Charts)


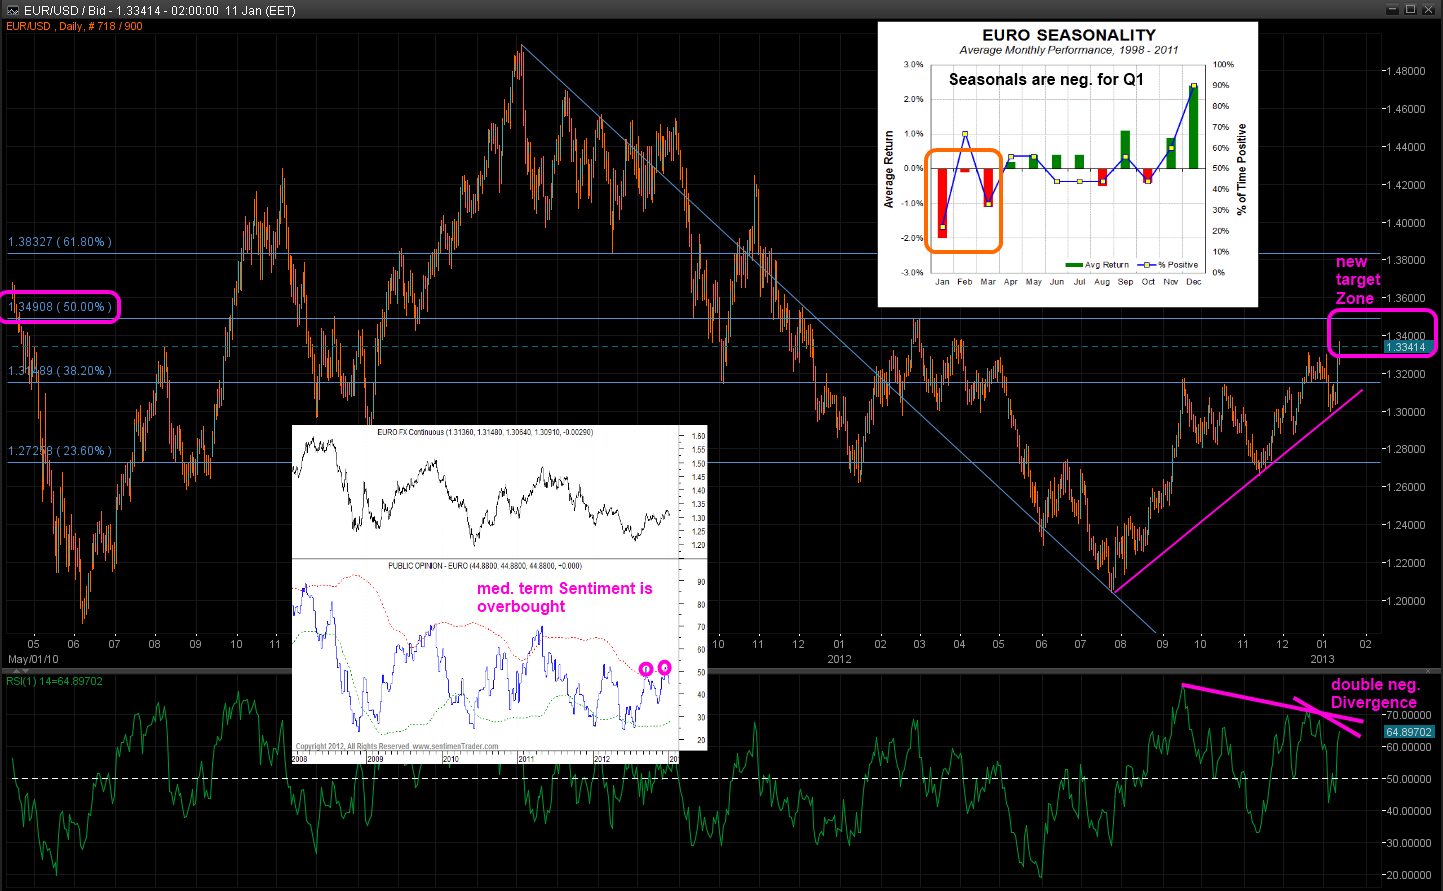
Friday, January 11, 2013
Double and triple Divergences in most Sentiment Indicators and the EURO


Subscribe to:
Comments (Atom)