Saturday, August 28, 2010

SUSI WEEKLY UPDATE

We are looking for a bounce...

Golden5: Breadth has turned bearish


The overall Breadth picture has turned bearish with kick offs in the New Lows and Selling Pressure , beyond the turning of the 2 cum lines (grey & brown).


Exhaustion Watch

Panik has brought us some extreme Oversold Momentum readings that could let the market pause for some days.

The overall picture is short and medium term bearish and long term mixed.

Timing Ideas

In case Friday was not the pivot for the Bounce then we have Aug 31 as next opportunity, or Aug 31 could already be the the next pivot.....
We looked at the IWM (Small Caps) which has a clearer picture. (If nothing happens on Aug 31)
Gold shows a messy picture which allow multiple interpretations. Best bet looks for a Pivot around Sep 11-14.

FibTime update

The SPX follows the playbook and we have to see how far the bounce can go.

Was this now the expected blow out in Treasuries?

Gold had a good chance to pull back but it didn't which has to be taken as a bullish signal.

Tuesday, August 24, 2010

Confluence of FibTime Clusters in SPY and TLT/LQD

The updated FibTime run now hints at Pivot around Aug 29/30 which exactly coincides with our TLT and LQD (Fixed Income) clusters .

This projects a blow out in fixed income and S&P 500 intermediate low for Friday/ Monday.

Let's see whether Mr. Market goes for it....

Golden5: Sentiment: ...still some way to go

We are still way off some oversold readings and the news about the Ireland downgrade and the Yen action in FX market are certainly not helping....


Sunday, August 22, 2010

Why I'm bearish on Commodities

I don't even want to go into a China or Peak Oil discussion, therefore I let the pictures do the talking. The CRB looks awefully bearish and the entire bounce out of the crisis looks like a dead cat bounce. Not all charts develop such a clean structure as some of the commodities like Oil (similar to CRB) or Gold, but when they do they usually are high %.

What does it take to change my assessment to the bullish side:
  1. Price needs to recapture convincingly the SMA 55wk (we just did the opposite)
  2. We need the RSI to enter the RSI ZONE above 70 (better a good spike to 75+)
  3. take out of the 280 level (better the 295+)

The bullish case for Gold

Gold looks prone to correct for various reasons. (FibTime, Overbought, DeMark, Seasonals etc.). The question we have to ask here is what conditions need to be met in order to question the long term bull market Gold.

The chart shows a fairly robust pattern we have observed in Gold in 1999. A correction into the 1120 would be even be considered healthy.

So until Gold does NOT enter into the below RSI35 Zone and can defend or re-capture the SMA 55wk, Gold will continue the bull run.


Timing Ideas for the LQD and TLT


August 28-30 looks like the next good opportunity to top....

Bipolar disorder

If you want to know why more and more Hedgefunds are throwing in the towel, just have a look at the chart below and look at it through the lense of previously reliable heuristics.

A) "Dr. Copper leads the Equity market"
Observation: still working fine!

B) "The Fixed Income market knows better then the Equity market"
Observation 1 (2yr TSY): Armageddon is coming
Observation 2 (TED SPREAD): Recovery is coming

What's the right interpretation?
We don't know! The only thing we do know is that both the TED as well as the 2yr TSY are highly mananged by the 'politbuero' at the FED which doesn't help us here.....
I would follow Dr. Copper, who has not taken out the recent low like the S&P500 (non confirmation !!) and maybe the 2yr TSY given the bigger context...... but this is just my educated guess that can be completely wrong !!


Saturday, August 21, 2010

Exhaustion Watch

The bearish case seems to set it, but might need a pause to re-strengthen.
The move in Gold has matured and can be expected to pause. The action with the Banks hint a possible bounce.

The strength of a possible bounce and whether a bounce can change some of the medium term indicators will determine where we go from here.

We still have the monthly pivots supporting a bullish case and we need to see them flip before we can expect a complete bearish picture. (S&P500 below 1010)

Risk to the bears: A strong bounce
Risk to the bulls: An acceleration downwards

The downside case

Simply look at the beautifully fitting cyclicality. The 1937/8 Rhyme has to be seen at least as one possible alternative. Maybe not the base case but a possibility.

SUSI medium term special

When I first experiemented with SUSI I also set up a feature that does Fibonacci Fans and Retracements on Weekly Charts with a special twist. The Twist being that we apply these ratio on log-price data rather then on the raw price data (which then only gets charted on a log scale). Both approaches have their merits whereby the latter one is easier to chart and has therefore found its way into all charting software packages. I found the other variation as valuable as the popular one and when you look at the enclosed charts you will find the same.

I use the usual Fib ratios from 23.6-38.2-61.8-78.2-127-138-168 for the Fans as well as for the RETs. (The charts have no Y-axis for technical reasons)

Beyond that I played with the concept of important/ meaningful support/resistance trendlines (following some algo that weights and selects pivots for that). You will find these trendline in red and blue.

Here is what SUSI showed today for last week:

1) EURYEN

2) SEMICONDUCTORS (SOX)
3) GERMAN DAX
4) BANKS (BKX)
5) OIL & GAS/ Energy Sector (XOI)


Above you'll find selected key sectors and they all seem to tell a similar story. Maybe there is a way to spin this positively but I'm lacking the fantasy of how ....

The beauty of these charts is the fact that they present a true representations of Mr. Market's state of mind, because these levels are not frequently targeted and played by the ROBOT-traders that mostly focus on the popular Fib-lines to play their hunting games. (WHERE YOU ARE THE PREY!!). This is what I call my 2nd Derivative concept, where we look at what all the others look at, try to understand their conclusions and do something else ...like with a proprietary Indicator....

Bottom Line:
We have taken out some key Fib Levels and the Bulls have to regain those before we will loose the ghost named "DOUBLE DIP".

In other words, buckle up for some rough sledding into October.

SUSI WEEKLY UPDATE

SUSI sees a bounce coming....


...but given the SEASONALS and where we are right now we have to assume a mere reflex rather then the beginning of something new. We could be off, but you want to give the benefit of the doubt at this point in time to the bigger set up.


Capitalism 4.0: The Birth of a New Economy in the Aftermath of Crisis


1586488716.jpg


I'm reading currently Capitalism 4.0: The Birth of a New Economy in the Aftermath of Crisis from Anatole Kaletsky which is the KAL in GaveKal. They have written a couple of paperbacks throughout the years and I found every single one at least stimulating, forcing you to think again, reconsider some of your held beliefs, reassess some of your views..... .


Being a research boutique run by european economists based in Hong Kong guarantees you unique insights, interpretations and views. Their analysis are far from the fastfood quality we find at each corner these days, which makes for an interesting read.

Do I agree with most of their view? No, but to find someone that adds a fresh perspective into your framework is more then worth the read.

Capitalism 4.0 falls into that same category and lives up to my expectations.


================
One of my favorites is Jesus: The Unknown Economist which looks at the work of Jesus Christ through the lense of an economist.

Timing Idea for the Spyder

Taking alone the FibTime Cluster don't know where to go. If you combine this instrument with other indicators you get a much better idea as we have shown in the past.
Pls find here as a reference some potential bearish interpretations of the current FibTime profile. (FibTime has no BIAS , neither bullish nor bearish!, only the Analyst that uses this tool.)


Watch Gold next week according to our FibTime analysis and the Seasonals we should see some interesting and informative action next week.

Golden5: Breadth turns more bearish


Pls observe a change in character in weekly installments......

EURO Gartley on target , TLT Gartley died this week

Looks like more downside potential for the Euro.


Looks like the TLT will follow the Corp. Bonds into a blow out.

Corporate Bonds look like an explosion prone to happen... UPDATE

We will follow this blow out in real time. Once gravity set in the herd will run for the exit. All the greedy yield chasers are hiding here....


Wednesday, August 18, 2010

Weird OPEX action


The fulcrum day is behind us, Equity hedges are growing but no action in the cash market......

Something is up here, you can clearly feel but not see it. Mr. Market will reveal his real intensions when nobody expects it!

Sunday, August 15, 2010

Gold Seasonals


We've been writing about the bullish action in Gold lately, have shown you our FibTime Cluster and thought to compare this with the more prevalent Gold Sesonals.

The Seasonals Chart shows a propensity for meaningful low btw. the end of August and early September. The Chart also shows a tendency to have a final run to the seasonal low around AUG 22 +/-.

Maybe we can skip this final move down, maybe not the next to weeks will tell.

For more SEASONALS look to the right of the Blog at ADDITIONAL INFO.

courtesy of http://www.spectrumcommodities.com/education/commodity/charts/gc.html

Saturday, August 14, 2010

SUSI WEEKLY UPDATE


Our SUSI is opinionated, as always she is taking a stance a clearly URSINE stance. She believes in De-Leveraging carried by a stronger Dollar, led by Liquidation in Small Caps and Commodities. Let's see where her female intuition is taking her.

We are going bearish in the OPEX, so where is the Point of no return?

1010! The Neckline of the Head&Shoulders Pattern everybody is looking at which is also the July Low which once broken would also flip/ neutralize all the Monthly Pivots back to bearish.

Golden 5: Sentiment: Put/Call ratio


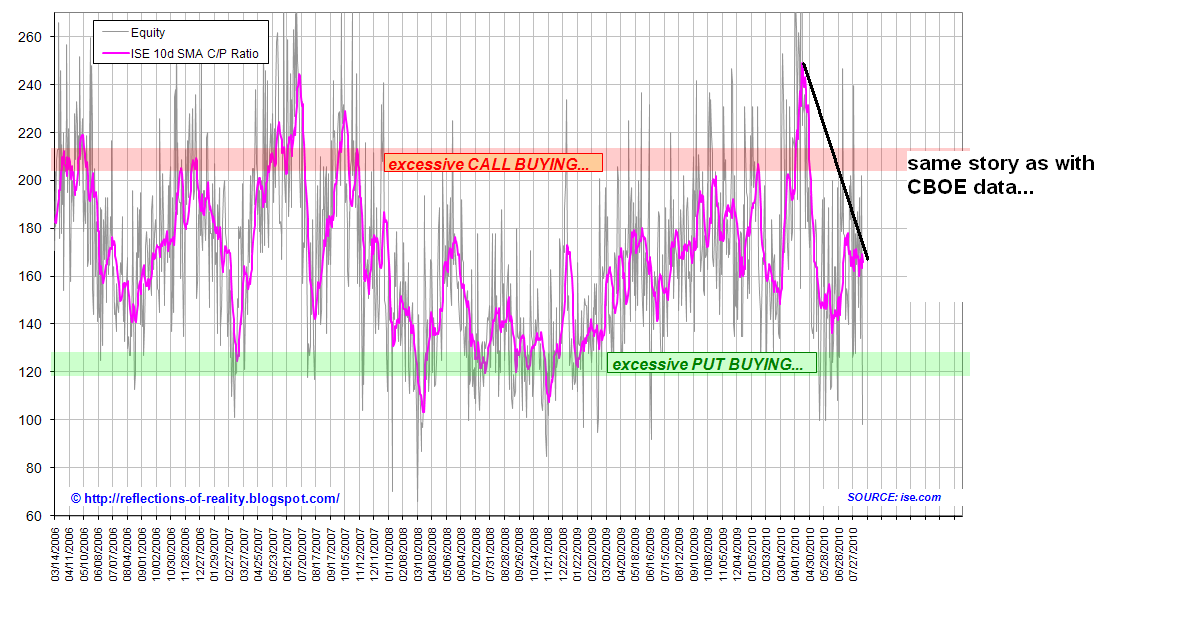
CBOE and ISE Equity Option Call/Put data tell the same story that...
  1. the Market has flipped to the downside
  2. the last High was weak (halfway through the range)
  3. there is lots of space to cover/ run through on the downside
  4. structurally a weak follow on high usually acts as kick off

Timing Idea for the Spyder

FibTime revisited


We're looking for Aug 6 to be the big turn day (posted on Aug 3) and it became the next business day.

Golden 5: Sentiment into the August OPEX

The Bias is bearish and it seems it doesn't come to early like in the last 2 OPEXs where the 'playas' then got a chance to squeeze it. Let's see...


The intermediate Picture looks bearish too given where equity options (measured by the 10d Call/Put ratio) decided to flip (rather than going back up all the way which seemed possible). Now from a little distance we can also assess the degree of exuberance we've had in April which hints at the notion that we've seen a medium term HIGH.

Our 2 VIX_OSC Indicators have been proven as some of the more reliable Indicators. (Trading against them is a fairly high risk endeavor!!). Both tend to lead the Market, both warned us of exuberance the last 2 weeks. Given that they decided to congest rather then spiking it was a fair bet that we would not have to wait for a neg. Div to resolve the extreme. And So it happend!!

Heading now into the OPEX is looks like we could see some further downdraft next week which aligns with the interpretation of the other Sentiment graphs as well.


Corporate Bonds look like an explosion prone to happen...

Look at..
  1. The monster Wedge formation
  2. 80level in the wekly RSI
  3. steep rising trendline in the RSI
  4. potential neg Div. in the MACD
  5. the absolute level of the MACD
  6. falling Volume
  7. relative Weakness
How could this play out...
a) it simply falls from here in the next 0-2 weeks
b) we fill have to wait for a neg. Div in the RSI which means a shallow correction followed by a final push up.

Corp Bonds have been an Asset Class to hide, so what will happen if that doesn't work anymore. Where could they go from here...GOLD, Treasuries....anything can happen here in the AUG-NOV timeframe.

Golden5: Breadth

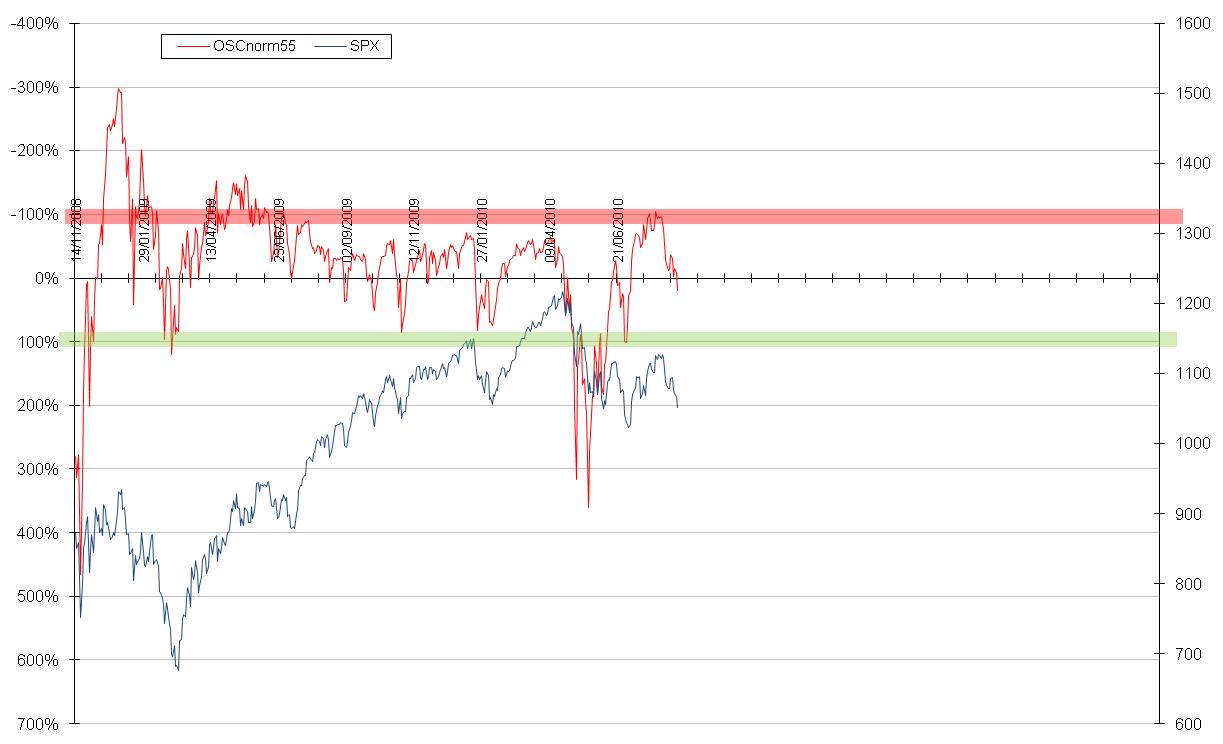
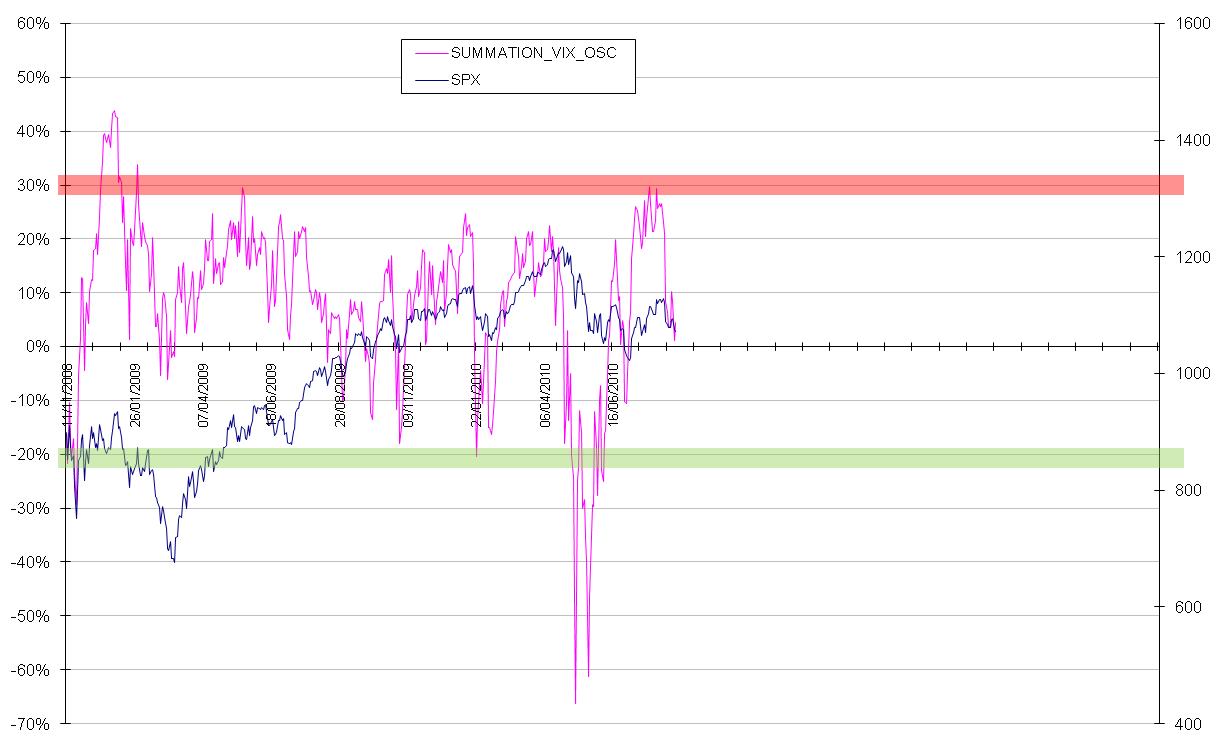
We see the bearich winds appearing in the Breadth chart, but need more confirmation.

Exhaustion Watch: ...after the Wedge resolved...

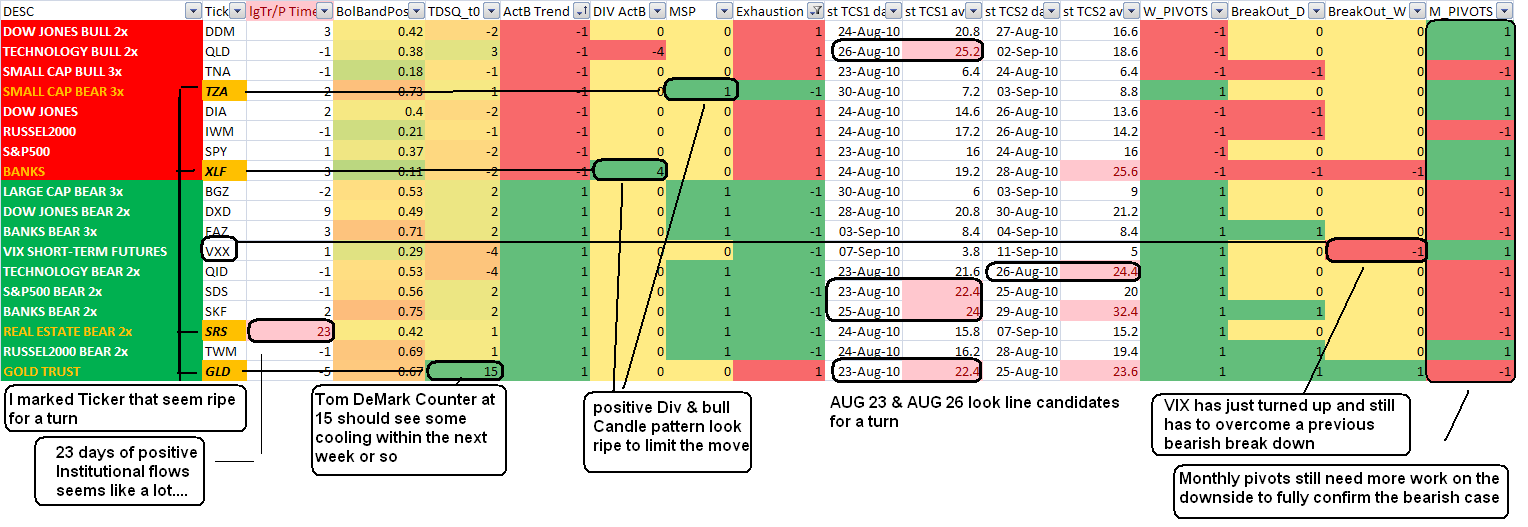
What a differnce a week makes! All of a sudden everything aligns the s/t Trend, Exhaustion, Breakouts.
Aug 16 & 22 seems like the next turning windows which are around the OPEX. Let's see how that plays out.