Friday, September 30, 2011

Sentiment and Liquidity have kept us honest

The current fall in Liquidity is only comparable to 2008.


The VIS_OSC2 shows weakness that could lead to an exhaustion event in October.

Our VIX Fair Value seems to support that notion.

Sunday, September 25, 2011

Algo Madness

If you ever want to understand where the crazy volatility of the last years' is coming from or where the liquidity has gone over the last decade or why we had a Flash Crash, then you need to look at the chart below. The Machines have taken over the trading.....


Nanex: Incremental build-up over the last few years of superfluous quote traffic over the course of the day. That is to say, quotes which are entered into markets systems but are never actually transacted, hence they are Spam.


GOLD-TLT Correlation broke as promised


The Correlation broke but this time Gold left the Safehaven story before the now tremendeously
overbought TLT...

...but when you look at last times when we had these kind of correlation extremes we observe that usually one Safehaven leads down (=> correlations go down) and that when both have corrected the correlation turns up again and both Safehavens start to rise again.

So this would jive well with our TLT view where we could expect the US Long Bond to follow Gold into a severe correction, followed by a joint upturn again. How long will they part ways and when will they reunite, only Mr. Market knows.

The extreme oversold Gold market and the extreme overbought TLT could indicate that this could happen sooner than later. On the hand the correlation has just turned down and could go longer.....


watch the space !!


Saturday, September 24, 2011

Contrarion Trade of the Year: SHORT the LONG BOND


Last week we showed the GARTLEY pattern which the TLT blew apart....but the case gets stronger and stronger. When this starts to tumble then think in terms like SILVER or COPPER last week.

Precious Metals and Institutional Money update

Silver took a material beating and could bounce from here. How far ...we don't know, but probably into mid OCTOBER.

The GOLD OPTIONFLOWS tell a similar story. We had the beating, the pressure relief....now what's next...?

Silver looks deeply oversold. Last time we had those oversold level....yeah you know....
...same for GOLD...


The INSTITUTIONAL MONEY Optionflows look weird as if we have too many players hoping for a supercharged upside bounce .......?!

The TimeCycles are bearish into mid October (same as Silver with opposite signs ?!)

Sentiment: BAIR RAID is not over yet

Vix seems fairly valued at these levels and could allow for more downside action.


The VIX_OSC has no clear opinion....

...but his bigger sibling the VIX_SUMMATION which takes the path of the VIX_OSC into account looks to paint another re-test into late OCTOBER.

Friday, September 23, 2011

Liquidity still deteriorating


We have reached last years degree of deterioration. Will we stop here...?
On the other side our index foretold us of the coming re-test!!

Gold Correction could halt here


Reasons why...
  1. weekly RSI at the 50 area
  2. current correction at the FIB 23.6 % level
  3. at Trendline
  4. at or close the EMA150
  5. resembles in size most correction since 1999

Silver got whacked again...and today even more...


From a technical perspective this is as good as it can get...

  1. extreme RSI reading
  2. double Fib Cluster
  3. medium term support
  4. Volume resistance area
  5. symmetrical A-B-C pattern

Thursday, September 22, 2011

Silver got whacked almost 10%....

...exactly into the time window where we expected it. (chart is from EOD Wednesday !)

Wednesday, September 21, 2011

1998

1998 looks like a good pattern for the market from a seasonality perspective. It also fits with our view thatwe could see more bearish action into October.


.....this Rhyme also looks at some fairly bullish action out of the October low!

Sunday, September 18, 2011

Did u see the GARTLEY Pattern in the TLT ?


(a) A beautiful GARTLEY Pattern which needs a breakdown as confirmation. Once we see the breakdown and bear in mind that we are right on the FIB 76.4 level then we should see some solid bear action. (CONFIRMATION is key !!)

(b) The weekly RSI is at a level where it usually confines further up-moves.

Relative Strength

Nasdaq & Semiconductor stocks were extremely strong during the bounce.

As long as we find the Banks and the BRIC stocks on the right side of the chart and the safehavens and marterials on the left side, we have to assume an impaired and unhealthy market structure .


Saturday, September 17, 2011

....and then there is Dr. Copper

...and he seems not to be too optimistic about the nearterm outlook.

The Precious Metals are torn btw. a rock and a hard place

The Option picture is muddled right after the OPEX (Option Expiration)


The Momentum side looks like the complete opposite where when bearish indicators cannot trigger a bearish move we have to assume a bullish outcome.


...and the same must be said about the timing model where we experienced a perfect cycle inversion (meaning the turning dates were right but an expected low turned into a high and vice versa). If this continues then we should see a rapid move into the potential volatility month of October.
We could also see an end of the inversion with the Prec. Metals diving into mid October......

Institutional Money Portfolio seems neutral with downside risk into late October

The Optionflows Indicators all are on neutral which can cut both ways.


The TimeCycles model on the otherside hints at another re-test with the potential of a tradable Low in late October.

Mr. Market follows our ROADMAP /Episode 3


We posted on June 16 the follow up to our ROADMAP:

JUNE CONCLUSIONs:
  1. We have entered the airpocket with a material breakdown - DONE !
  2. expect a test of the 200d SMA & the March 2011 LOW - DONE !
  3. ...if the 200d SMA does NOT hold then expect a tumble though the airpocket and a subsequent test of the May 2010 in late July (August) seems likely - DONE !
  4. ...if the MAY 2010 HIGH does NOT hold then plan for the FIBs (expect some sideways action around those levels given the Volume cluster in this price area) - DONE !
  5. ...if we break through the summer LOW of 2011 expect more than a medium term correction - DONE !
  6. (SEP 17, 2011)...now that 1-5 have materialized we have to add chapters to our story. After testing the 38% Fib level Mr. Market consolidated n a textbook Flag Pattern up into the Airpocket again right around the Option Expiration and close to the Month & Quarter End (window dressing). The correction took place with decreasing volumes. The next target should be the 2010 LOW which coincides with the 50% Fib level. This could happen all the way through October.
  7. ...if 6 occurs anything can happen from there. A waterfall down or a monsterrally up.....bear in mind that every politician and centralbanker around the world will pull all stops to intervene at that stage.....

Friday, September 16, 2011

More Liquidity drains out of the Market

  1. Liquidity is further deteriorating
  2. we have taken out last year's LOW in the Index
  3. previous moves went further (210,160)
  4. when previous moves had reached sililar levels around -150 and were at a strage where the market had just experienced a short-covering rally the market tended to go for one more re-test of the price low.

Sentiment update: Short-Covering relieved the excess pressure....

....and once the OPEX (yesterday) and the month end and quarter end (window dressing) is behind us we could expect more turbulences.

This also reconciles with the FLAG (correction) Pattern Mr. Market has painted and has clearly some bearish bearings.

Expect the SHORTS to re-load.


DOLLAR aims at 80

Textbook action in the DXY. After taking out the 1. Fib level we saw a re-test that held. This indicates the DOLLAR wants to test another stair-step up to test 78 and eventually 81.

Remenber that strength in the DXY is highly correlated to the RISK OFF trade.

Sunday, September 11, 2011

SAFEHAVEN GOLD-Lond BOND angle: Short term correction in Gold

Our 2 Safehavens have reached a 1yr Correlation extreme which in the past decade led to short breaks/ pauses/ corrections in both hiding places.

Don't expect less over the next month or two into October.

Dollar Strength actually is good for GOLD


We looked at the Dollar-Gold 1yr Correlation since the 70ties and found that with one exception a rising Dollar and a rising Correlation coming from negative correlation levels of below -80% usually seem to act as jetfuel for gold.

To better understand the pattern imagine the following sequence of events...
  1. Gold rises ,
  2. Dollar tumbles ,
  3. "end of the Dollar" seems approaching
  4. inflation expectations rise
  5. asset prices begin to fall
  6. dollar rises from deleveraging and reserve currency status and certainly from EURO weakness ( <=> ".....dollar is the least bad currency out of a basket of bad choices")
  7. Safehaven SWISSFRANC disappears
  8. QE3, QE4 ... and European equivalents and all sorts of "fiscal and monetary fixes and programs" are expected
  9. inflation expectations rise again (in an actually deflationary environment)
  10. Gold is extremely overbought but doesn't really put in a deeper correction and simply corrects sideways (over time)
  11. BUYING PANIC in GOLD arrives !!
There is a chance that we are in stage 9 and/or 10. If Gold just buys time over the next weeks and the stock market falls another x% and the political class opts for "fixes" then better start moving into Gold, Cash or the Dollar (or all of them).

Gold Correlation Rhymes

There were a couple of Safehaven episodes with falling stock markets and rising gold prices.
They usually got really exciting when the stock markets began to bottom (think QE3+).


Look at this innocent Rhyme which resembles today quite a bit. Notice the extrem negative correlation and how it led to a correction of the gold price. The stock market fell some 20%. Eventually stocks started to rise again and took gold with it for the ride ....


.and gold rose and rose....and the rest is history.


Conclusion:
If the stock market falls too far, the ensuing money printing could trigger a replay of the late 70ties.

Saturday, September 10, 2011

The vagaries of September

The Market needs to fix the performance of the Materials and the Banks. These 2 sectors are key!!!


The Materials don't look good and they were former leaders

The next MOMO chart bring home the key message fro september:
IF A OVERSOLD MARKET
CAN NOT BOUNCE IT WILL CRASH!!

BANKS look like more pain...

...as does the Spyder

Safehaven Outlook for September

The 2 key safehavens are Gold and the Long Treasury Bond (TLT).

TLT's optionflows paint a mixed picture within a severely overbought market for the TLT.

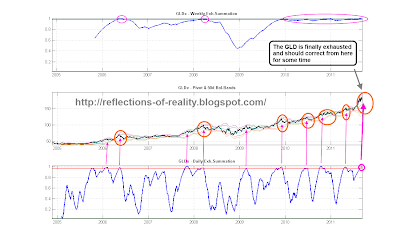
The Exhaustion chart shows a neg. Div in a highly oversold market which normally should halt, pause or correct the move to some extent.

On the Gold side, I'd like to bring your attention to the GDX (Goldminers) that have broken out this week with the risk of painting a fake break out move given the extreme Optionflows!
If the miners fail then Gold should feel the affect.....

The Timing chart point into the same direction

The Gold Optionflows still need to be interpreted in a bearish way.
The Exhaustion picture needs no comments.