Saturday, August 29, 2009

GOLDEN 5 BREADTH & Sentiment

This is our McClellan Summation and Osc. (bottom 1/3rd) combined with an STORSI on the Summation INDEX. This has all been applied to our MUST HAVE INSTITUTIONAL/ FUND MANAGER PORTFOLIO.
Don't get confused by the technicalities. The purple SUmmation Index is deeply Overbought, the blue STORSI (middle portion of the chart) has turned and the OSC (green line) sports a lower high (neg.Divergence !!).

Conclusion: It can't get better for the bearish case!!

Here again our standard breadth chart covering our Institutional BUYING and SELLING PRESSURE (bottom) compared to the 20day NEW HIGHS an NEW LOWS.
Both show lower highs in both categories = weakening rally !!


Also pls find our 2 classic version of our VIX OSCilators, which both show lower highs that do not support a healthy rally. Have also a close look how both OSCs have behaved last fall/early spring when both displayed higher lows in spring and thus signalling a rally.....


Bottom Line:
the rally is..
  • unhealthy
  • weakening
  • with deteriorating participation (look at the insane volumes of CITI & AIG and what % they represented of the overall Volume on those days last week. Those "sickos" can not lead a healthy rally!!!)

SUSI WEEKLY UPDATE


  • SUSI has turned bearish with all sectors and most commodities now in bearish territory
  • NAT. GAS you want to have on your watchlist for late October !!!

General Remarks:

Susi produces 2 kind of key signals, that are the Exhaustion and the trading signal. Pls bear in mind that exhaustion signal are always mean reversion signals and will lead to failures in case of extreme moves like last fall. Therefore we have our trading SUSI signal that counterbalances the mean reversion nature of the exhaustion signal by being more trend following.

All in all it means you always have to assess the signals in a broader context. We use therefore the GOLDEN 5 Context as a framework.

As of today the GOLDEN 5 leads to a historically overbought and unhealthy and lopsided rally which seems to fade.

FADING doesn't mean DYING!!

The Golden 5 provides only the context but not the timing whereby SUSI offers the timing but not the context. Combining both is clearly an art.

As the earlier post indicated "Time is up" but it could also run into Jan 2009 and still be considered a bear market rally.

....so be careful out there REFLECTIONISTAS

SUSI is turning neagtive.....

^dji: Dow Jones, XLI: Industrials, CRB: Commodities, ^BKX: BANKS......
(find more in this week's weekly update)


Friday, August 28, 2009

TIME is up....

don't be like this guy....


Let me re-post this graph to alert you that we're entering into the ZONE where a major correction could happen. The price target has been reached and the time target is close enough to put you on RED ALERT.

The S&P500 has some serious RESISTANCE above in the 945-950 area and any break from here should be taken as an opportunity to look at he short side. There is still more upside possible but is seems we are at the 1st good crossroad.

The degree of optimism in the market and the analogy to 1938 should also put you on alert because Mr. Market never goes where they want him to go or where the HOMO ONIVUS goes... (=the herd man)


Emerging Markets

In our SUSI Pattern Chart you find 3 different kind of signals next to our standard auto trendlines.
  1. Diamonds: Exhaustion Signals,
  2. "little clouds": CTI(w) (Cycle Turn Indicator - weekly),
  3. circles: regular Susi trading signals


In our SUSI Chart you now find:
  1. the SUSI Signal (lower lows or higer highs around the SUSI Indicator) like the EEM SELL SIGNAL
  2. The CTI(W) that is rather Overbought and lies on top of a combined DAILY+WEEKLY+MONTHLY CTI combination (Cycle Turn Indicator )
  3. OUR TCs (TimeCycles: high probability Fibonacci time projections clustered) that show some potential turning points for mid Sep. and mid Oct.
  4. Our new TIMEBANDS show potential HIGH or LOW Time projections based on classical cycle analysis (for differnt timeframes), which show 2 longer red lines indicating a potential low in the Oct. Timeframe.
(the red and green points on the blue closing price line show Tom De Mark signals as add'l reference)


EM is supposed to be the pulling forces in the economic upturn.
Susi seems to thing otherwise.


The Defaltion Twins...


The Defaltion Twins are still on course and seem to confirm the topping pattern we observe in the other Markets.


why are the twins important...


  • If Inflation, as the consensus believes, is the main risk (inflation= rising asset markets) then the 10yr TSY yield has to go up, but it doesn't....


  • If China carries the world then the FXI (CHINA ETF) has to lead the S&P 500 and confirm all the new highs, but it doesn't...


More evidence can also be found with the BALTIC DRY Index that still seem to have missed the news that the worst is behind us.....



Saturday, August 22, 2009

SUSI WEEKLY UPDATE


Dear fellow SUSI'nistas, we have done some facelift to our gal which improves the signal quality and reduces the noice.

Susi now differentiates btw strong exhaustion signals and shorter term trading signals. Susi also has now improved the TC (TimeCycles) functionality for the timing dimension.


Bottom line:
Mr. Market defies gravity for the time being and will have a date with destiny. Can it melt up further.....YES it can....., but you have to understand that each day up stretches the rubberband further and will make the reaction or countermove more violent.

The TCS's (TimeCycle Spikes) hint at some turbulent Sep. & Oct. with fits also into the seasonality.

BUCKLE UP !! it could turn into a hell of a ride, because you can't find any bears anymore let alone deflationists. Mr. Market has a peverse way to always give us the unexpected....

Saturday, August 15, 2009

SUSI WEEKLY UPDATE


  • the market has not turned yet and the bulls are still in control
  • next week is option expiration, remember last time (!!) when a correction seemed to be running and they forced a brutal, vertical bull campaign onto Mr. Market.....let's see what we get this time....
  • commodities flipping should signal more downside
  • the market is so overstretched that with each add'l bull day the risk of a disater grows
  • read the follwing twice:" A HEALTHY MARKET NEEDS BEARS AND bulls".....we have lost all the bears !!

Tuesday, August 11, 2009

Position of the Risk Trade

VIX OSC:

Pls find below both variations of our VIX OSC. Both seem to turn and both seem to continue sporting gigantic divergences (lower highs vs a rising stock market) which raises at last a huge red flag !!!

RISK TRADE UPDATE:
With our late bloomer the banks are gettin taken to the woodshed yesterday we have to re-evaluate the position of the overall RISK TRADE.
So far we have a nice divergence in the VIX, some early move on the FX side, but we still need to see confirmation on the credit side.
in plain english:
WATCH HIGH YIELD !!


Monday, August 10, 2009

Are we there yet...?


The 1st chart indicates that the structure of the rally seems too explosive for a regular new bull campaign........


The 2nd chart shows us that we've reached the min. requirements for a bear market rally. The 1938 comparison and the dow theory confirmation on friday indicate that it could run another month to tag the 50% in Time & Price.


Bottom Line:
  • Seasonality, China, Baltic Dry, Nasdaq hint at quick turn....
  • ...but time and price targets could see some more aging.....

Sunday, August 9, 2009

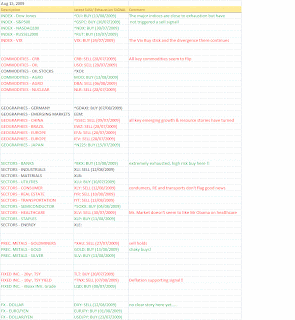
SUSI WEEKLY UPDATE

BANKS are now out of the woods.....(?!?)


Highlights of the week:

  1. vertical rise in the banks resulting in exhaustion
  2. failure of china & tech to follow
  3. break down of the Baltic dry Index (Shipping cost!)

Thursday, August 6, 2009

Seasonality


We now enter into the high Volaltility season for the stock market. We are also in a post election year (US: Obama+1) which also comes with certain seasonal factors.

Wednesday, August 5, 2009

NASDAQ SUSI update


  • SUSI Indicator is in a topping position
  • TC (TimeCycles) indicate chance of a turn
  • Tom DeMark Signals

Bottom: The probability is good for a turn.

Saturday, August 1, 2009

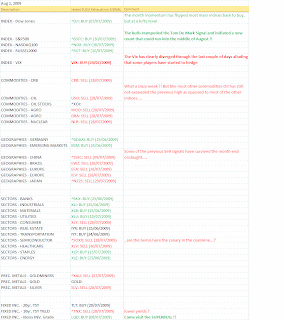
SUSI WEEKLY UPDATE


This is a very dangerous market with many cross-currents.

  • The fact that we couldn't break out on friday with the "good"(benchmark revised) GDP numbers
  • ....and the fact that Energy stocks couldn't join Friday's OIL (and sell the DOLLAR) party
  • ...and that the VIX (Optionmarket) and 10 TSY Yield send bearish signals ..
  • ...and that Mr. Market couldn't run more with all the weak DOLLAR tailwind (which would have led to an upside explosion some weeks ago..)
  • ...and that the leading Nasdaq shows realtive weakness ....

.....against the backdrop of a MOMO-infused bull run means RISK!!

THE LONGER THE "RECESSION IS OVER" EUPHORIA RUNS (without any cooling off periods) THE DEEPER THE CORRECTION WILL TURN OUT!