

When we do our daily OptionFlow analysis we always ask for the driving forces of the day. For the last couple of months we clearly identified
AAPL, GOOG, BAC, JPM, GS, FCX as the key leading large Cap Stocks. It should come as no surprise to find the BETA MONSTERS Apple & Google as well as some key Banks next to a Gold stock (Freeport) in that Group.
We know we are in an environment with exuberant MOMO, deteriorating BREADTH, deteriorating VOLUME/ Money Flows, so we when can we tell that the Market is ripe for some correction? The answer is, when some of the ALPHA DOGS start to behave badly. Bad action can be break downs and/or Pattern failures or relative weakness.
AAPL: solid upside action, buts sports a neg. MOMO Div since Sep/Oct
GOOG: shows relative weakness in the last 60 days
BAC: shows relative weakness since APRIL !!
JPM: shows relative weakness since OCT. 2009
GS: shows relative weakness since OCT. 2009
FCX: solid upside action, buts sports a neg. MOMO Div since Sep/Oct
The Banks are behaving badly , Google is weakening , so the entire Market hinges on AAPL and FCX. The Moment they fall the entite Market will follow.
 Solid outflows but no price reaction yet !!
 ...same
 How much deeper? Volume/ Flow looks good, Price MOMO might have another leg down up it's sleeve.....
 Banks look bad !
 Core Hldgs still bearish.
 same in TECH
 Bullish Optionflows in GOLD !! (maybe another last leg down down...?)
 Banks look VERY bearish


 The Trends get more and more tired by the day with ample of divergences, sell signals, overextended cycles etc.


 Momo is still OVERBOUGHT, but we see a substantial deterioration in the MoneyFlows.
 The Precious Metals are showing a very similar picture. We have a neg Div and extinct bears.
 MOMO is still weakening and still seems to have some way to the downside. On the other side we see a higher low in the Money Flows which is positive.
 The story in TECH is also close to the one described above.
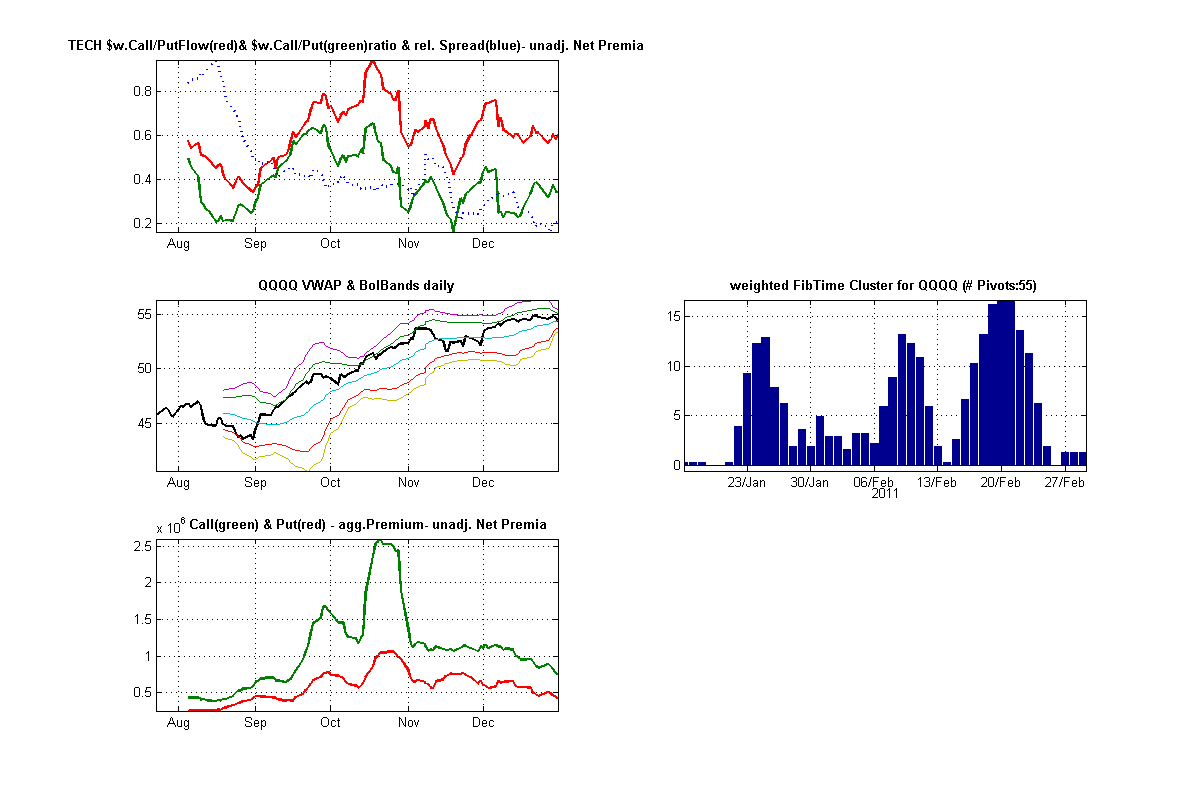 ...look also at the Money Outflows in Tech
 Nobody dared to bet against the banks (red line bottom chart), but nonetheless they seem ripe.

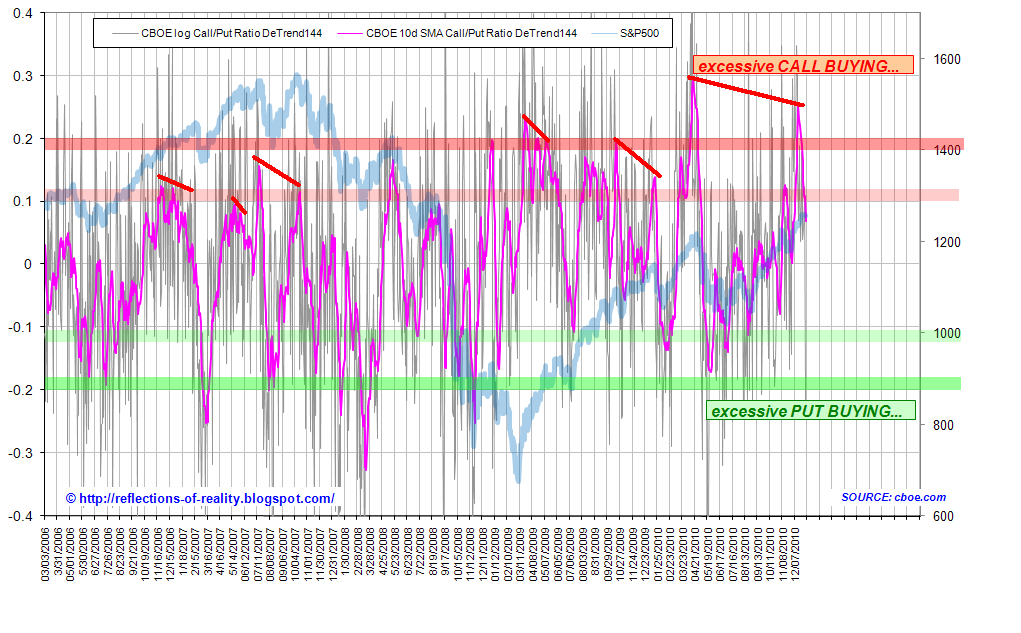
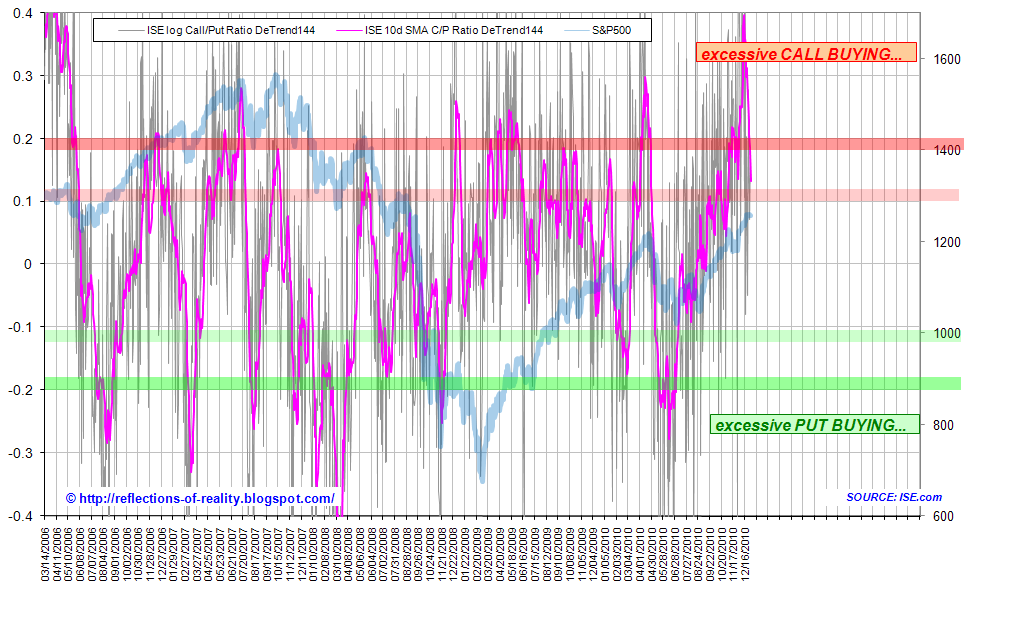 Short TRADE opportunity:

 ...at TECH
 ...and Gold Miners!!
 It can go further from here, but it will get harder by the day.


 ...and the same for the TECH group.

 We just had the most excessive bullishness in years!!


