SPYDER/ S&P500
A Spike up and above 1120 in the holiday season on less compelling Volume contains the major risk of a headfake unless we see some follow through in the first week of Jan....
GLD/ GOLD
...doesn't look too healthy, maybe bottoming in a week or two.... (mid Jan ??)
Tuesday, December 29, 2009
Monday, December 28, 2009
EUROPEAN vs US CREDIT Contraction & Mutual Fund Flows
If you're looking for a loan (commercial or consumer) in the US, you better wear your best suit...
Sunday, December 27, 2009
Sunday, December 20, 2009
SPYDER FLOW from Mar 3- Dec 18
The blue line representing the large Traders show how the big money has supported this rally and also when it decided to take money off the table.
Isn't it pure coincidence that the smart money deserted right around the time when the Equity Mutual Fund Investors decided to take it easy on their US domestic Equity allocations .....?
All in all you get the picture why Volume has deteriorated so much if only the machines and prop desks are left to play AIG and Citi......
Saturday, December 19, 2009
Investment Flows and Bank Credit
SUSI WEEKLY UPDATE
- Dollar rally has begun with a vengeance
- 1o Treasury Yield indicate some deflationary tendencies
- Gold and Dollar might pause a bit here before going the next leg. Both seem to not have reached their targets yet (mid Jan 2010 ; look also at a Chart of SLV for silver with a clear trendline breakdown)
- All 3 main Indices are on solid sells
- Brasil and China have left the party and seem vulnerable
- Japan left in September
- Banks have developped a picturebook rolling top (look at JPM !!)
- Industrials (XLI) flipped beautifully to the downside
- ...but what the hack is the VIX doing (maybe related to some positioning in this week's OPEX - Option Expiration)
- some commidities show resiliancy against the dollar picture
- WATCH the DOLLAR (Dollarstrength <=> stable Equities !!! something has to give here, we are stretching a rubberband and either the dollar will fall back or Equities will surprise to the downside!!)
- nobody seems to be interested in weakness around yearend, let's see how long they can uphold the tide
- recent Volume Flow Charts (will post an update next week) indicate that the institutionals have continuously taken money of the table since September
Friday, December 18, 2009
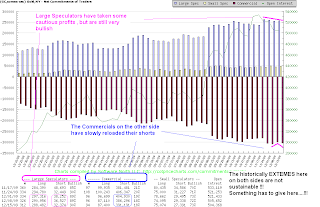
COT Update on Precious Metals and the Dollar
Silver:
...is a a beautiful case study of the structural shift in the perception of Prec. Metals and furthermore of a "normal" correction of excessive long and short positions.
Gold:
We have a similar extreme position here like in Silver with the difference that the Commercials have restarted the shorting. This situation is not sustainable!! Only one sode can win where the commercial bet on much lower prices and the large Spec's on the opposite. My bias goes with the Commercials because the large Investment banks are also classified in this category and tend to have an edge.....
The upturn is now also visible in the COT report!
Thursday, December 17, 2009
Saturday, December 12, 2009
SUSI WEEKLY UPDATE
- The Dollar has flipped which could mean a lot of liquidation going forward for at least up to March
- All major indices seem to develop tops
- Let me remind you that "bottoms are datapoints" whereby "tops are processes" , i.e. this could morph into a rounded elongated top rather then a quick downdraft. This would also fit into the yearend seasonality where nobody wants a big down impulse.....
- Most commodities also seem to have turned which supports the liquidation theme
- The TimeCycles seem to hint at some important point in JAN 2010
- GOLD & SILVER seem to lead the correction, which will probably not go in a straight line...
Contrarian Question of the Year:
What if GOLD is doing more than the expected (me included) correction down to 1070-1030 and instead decides to go deep......everybody seems to be married to the correction idea....??
We will follow this development in detail here at REFLECTIONS.
Dynamic Trading View on GOLD
Here you see where are the Gold Time Cluster (Indicator below the Chart with a spike around the end of Jan 2010) and Price Cluster.
Financials and S&P500 FLOW update
The Financials look very bearish. Keep in mind that the market can NOT rally for long without the financials!!!
The Spyder still seems undecided with a bearish bias on the large Traders side (Institutionals). We are clearly at a major resistance which can mean a consolidation towards the next level up or a rolling top. The next week will answer this question.
Pls don't forget that we are in the low volume holiday season where the "PLAYAS" at the prop desks can do whatever they like without too much institutional interference..... (see the orange small traders line creeping up which shows price moves accomplished with low Volume)
Gold just in a quick 6 week correction ...?
Friday, December 11, 2009
High Vix FUTURE premiums normally mean something ?!
Does this look like a healthy volume supported rally ?
(55 day Moving Average of Up Volume/ Total Volume)
.....before getting too excited pls. bear in mind that the big guys channel a fair portion of their volume through dark pools and ECN's (electronic communication networks). Like in the Casino the HOUSE likes to have a secret advantage up their sleeves.....
Mutual Fund Flows & Insider Sales
Tuesday, December 8, 2009
THE DAY the US$ broke out.......
- Trendline break out
- 50 day Moving average break out
- confirmation of the 2 closes above the 50MA
This is big, because it could mean the 1. round of short covering in the US$. Given the direct high inverse correlation with the risk trade this could mean that some TURBULENCES are ahead.
Just see what is happening to GOLD, OIL etc.
Consumer & Banks
The Consumer Credit data still looks abysmal. This is the deepest fall since WWII. Revolving Credit (read CREDITCARDS) get repaid at lightening speed
Pls also see these MUST SEE Videos from Whitney on the Banks. (hat tip to trader mike!)
Monday, December 7, 2009
Saturday, December 5, 2009
SUSI WEEKLY UPDATE
Key theme of the week:
We had 3 days back to back where the market popped up all the way through a major resistance field and got sold down towards the end of each day.
If we'd held above the resistance area the Market could have targeted 1200 (S&P500) or 120 (SPY ETF). The fact that it didn't happen is a strong message.
Even stronger though was the fact that run #3 was supported by "DREAM ECONOMIC DATA", reminding me that bull campaigns always end on good news and that the WALL of WORRY has now been torn down, now that we KNOW based on the employment data that the turn around has been accomplished !!
In terms of contrarian thinking this is Nirvana. You have 3 failed break outs with Volume and the last one on good news right around the 50% Retracement level (TIME & Price , pls see here) of the entire 2007-2009 crash.
- Gold got hammered
- the US$ had a great turn on Friday
- Banks still look like a bear flag that has never confirmed the S&P500 new highs of the last swing
- Small Cap look like the Banks
Bottom line:
Next week should be very interesting. If we see a run#4 that succeeds then expect a quick melt-up towards 1200 (SANTA rally 2009). The current picture looks like we just had our SANTA rally and that we could see some downside action into Jan-Mar 2010.
GOLD Breakdown
So here it is!! The US$ has started to strengthen and Gold took a dive. This could be the beginning of a Gold correction where the 1. leg could run into Q1, 2010 with a target around the Neckline of the BIG Head&Shoulders. The Neckline also coincides with 2 Fib levels, namely the 61.8 Retracement of the entire last rally and also around the 61.8% Fib Level of the copy of the last bigger correction.
Below the Neckline we find a huge Volume cluster (on the left side of the Chart) which indicates a major Support area.
If we fall through this area things could take an entirely differnt direction.....
Pls bear in mind that if Dollar strength comes into the market that it could run for up to 1 year. (pls compare to last week's Gold Roadmap)
Friday, December 4, 2009
Margin DEBT: Bullish ?
Investment Flows/Liquidity & Credit update
STATE STREET CONFIDENCE Index:
This Index shows what one of the largest global custodian is observing in their Asset Portfolios (mainly Institutionals, Pension Funds etc.).
They allocate out of the risk trade.
MUTUAL FUND FLOW:
Retail Investors are taking profits. Temporary solace had been found in BONDS but overall the retail guys seems to behave more risk averse than what most think. What would you do if you are a baby boomer with no Fixed Income Annuity stream...... behave risk averse ?
EQUITY FLOWs raise the question, who is running this market up if NOT the retail and the institutional guys?
MONEY MARKET FUND FLOWS:
FED BANK LENDING REPORT:
COMMERCIAL PAPER:
Asset Backed and "good" Corporates are still struggling
Subscribe to:
Posts (Atom)