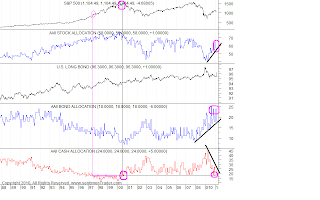
 As you see from the chart above, Money Manager Cash allocations have reached the lowest levels since the beginning of the Crisis. Most of the Funds been allocated into Bonds and some to Equities.
The last time we saw a similar level was around the 2000 Peak which can stipulate a bearish interpretation.
On the other side during the 90's bull run it was around 97-98 when we first reached the current level and it took another 2 yrs and a parabolic endmove to finish the Bull.
There you have it, both interpretations are conceivable.
I personally find the former more plausible then the latter because I find it hard to believe that the macro picture supports another 2 yr vertical bull move, but that's me....
No comments:
Post a Comment