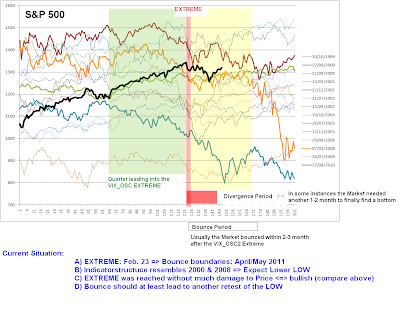
We looked at all situations over the last 15 years where our VIX_OSC2 showed a downside EXTREME after some bullish cruising....
In a next step we aligned all extremes and looked at them on a VIX_OSC Indicator chart and on a PRICE chart.
Here is what we found....


No comments:
Post a Comment