Saturday, September 29, 2012
Friday, September 28, 2012
Echo of 2007 ?
We updated our ISE and CBOE option charts and found an interesting constellation consisting of a sequence of 3 Extremes which is fairly rare. The only other time we saw a resembling sequence was around the BIG TOP in 2007. We also find it striking that this pattern can be found in both data series.
This should at least taken as a warning and fits nicely in the picture of all the other Extremes we have highlighted yesterday.
The current period develops a special signature which seems to evolve into those decade highlights we will remember in the future.
On the shorter term we have to wonder how many retests the bulls can pull of before they either bounce or fail.
Wednesday, September 26, 2012
Saturday, September 22, 2012
Breadth and Insider Alert!
Breadth as being a gage for broad market participation (here measured for stocks of our Institutional 'Must Hold' Portfolio has developped a negative Divergence as well.
Neg. Divivergences have a solid track record with a nearly perfect signal ratio since 2009, so we should take this serious and look at the risk trade with caution.
Corporate Insider have already started to take money off the table. We have an Extreme reading & a Divergence which further underscores the cautious message.
The degree of risk seeking has reached a multi-year high, now that the FED has given the green light.
Friday, September 21, 2012
Wednesday, September 19, 2012
Is CRUDE the first to tumble ?
Crude was one of those EXTREMES we alerted you about over the weekend. Will Crude be an isolated event or will the others follow. The Euro is testing the 1.30 as we write this so it seems the train left the station....
Tuesday, September 18, 2012
Sunday, September 16, 2012
Market at Extremes not seen in over a year!
The following PICs are from our Call/Put Ratio Series and from our OI (Open Interest Positioning) series. They underline the chracteristics of the unique juncture we are at through the lens of the Option Market (Smart Money).
We also looked at resembling Extremes and the nature of the entailing correction to provide you with a context.
It should also not be surprising that we find these Extremes in the core of the RISK TRADE:
TECH, EURO, BANKS, OIL, MINERS.
We also looked at resembling Extremes and the nature of the entailing correction to provide you with a context.
It should also not be surprising that we find these Extremes in the core of the RISK TRADE:
TECH, EURO, BANKS, OIL, MINERS.
Saturday, September 15, 2012
Red Alerts all over the place!
The Trend picture at Apple calls for caution....
The Dollar seems exhausted to the downside.Gold in Euros looks prone to flip down.
Goole feels like Apple.
The Small caps are the same.
Silve had a fantastic run, but....
The aggregated Flow-Momentum of the lev. ETFs shows weakness.
TLT (20 yr TSY) is falling apart.
Like Silver so is OIL.
We had a fantasctic 'post Olympic rally', which towards the end was driven by Hope and Centralbanks and plenty of Short-Covering.
This has the feel of a major Headfake into the weak season of the year.
Friday, September 14, 2012
Return of King Dollar II
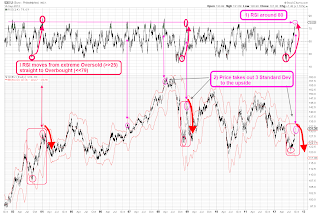
Then we looked at situations where the RSI went from extreme oversold to extreme overbought and found 3 occasions (2003,2008,today).
Bottom line:
The recent move is of a very rare and special nature and the odds favor at least a 50% Retacement (Euro 1.25) if not much more....
Subscribe to:
Comments (Atom)


